XRP Bears Resurface—Key Levels to Watch Now


XRP price started a fresh decline below the $2.450 and $2.350 support levels. The price is now consolidating losses and remains at risk of more losses.
- XRP price started a fresh decline below the $2.350 level.
- The price is now trading below $2.320 and the 100-hourly Simple Moving Average.
- There is a key bearish trend line forming with resistance at $2.250 on the hourly chart of the XRP/USD pair (data source from Kraken).
- The pair might continue to move down unless there is a close above the $2.3350 resistance zone.
XRP Price Fails To Recover
XRP price failed to continue higher above the $2.50 resistance zone and started a fresh decline, like Bitcoin and Ethereum . There was a move below the $2.35 and $2.250 support levels.
The price even dipped below the $2.20 support to enter a bearish zone. A low was formed at $2.0639 and the price attempted a recovery wave. There was a spike above the 50% Fib retracement level of the downward wave from the $2.604 swing high to the $2.206 low.
However, the bears remained active at $2.350. There is also a key bearish trend line forming with resistance at $2.250 on the hourly chart of the XRP/USD pair.
The price is now trading below $2.30 and the 100-hourly Simple Moving Average. On the upside, the price might face resistance near the $2.250 level. The first major resistance is near the $2.3250 level. The next resistance is $2.40 or the 61.8% Fib retracement level of the downward wave from the $2.604 swing high to the $2.206 low.
A clear move above the $2.40 resistance might send the price toward the $2.50 resistance. Any more gains might send the price toward the $2.550 resistance or even $2.5650 in the near term. The next major hurdle for the bulls might be $2.620.
More Losses?
If XRP fails to clear the $2.250 resistance zone, it could start another decline. Initial support on the downside is near the $2.1480 level. The next major support is near the $2.120 level.
If there is a downside break and a close below the $2.120 level, the price might continue to decline toward the $2.050 support. The next major support sits near the $2.00 zone.
Technical Indicators
Hourly MACD – The MACD for XRP/USD is now gaining pace in the bearish zone.
Hourly RSI (Relative Strength Index) – The RSI for XRP/USD is now below the 50 level.
Major Support Levels – $2.1480 and $2.120.
Major Resistance Levels – $2.250 and $2.3250.

Bitcoin Post-Election Rally Crushed: Prices Dip Below $84,000 As Tariff Tensions Rise https://www.newsbtc.com/bitcoin-news/bitcoin-post-election-rally-crushed-prices-dip-below-84000-as-tariff-tensions-rise/
On Wednesday, Bitcoin (BTC) prices plummeted to a four-month low, reaching as low as $81,000, as the...
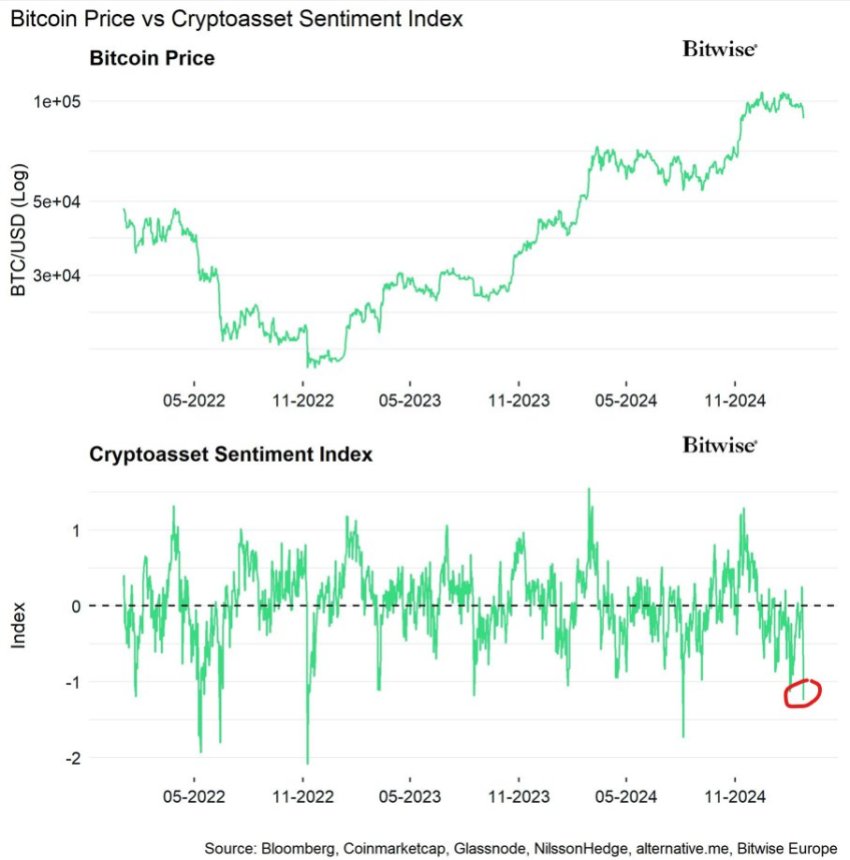
Is Bitcoin Undervalued? Crypto Sentiment Index Flashes “Massive Contrarian Buy Signal” https://www.newsbtc.com/bitcoin-news/is-bitcoin-undervalued-crypto-sentiment-index-flashes-massive-contrarian-buy-signal/
Bitcoin (BTC) has experienced one of its largest price pullbacks in recent times, plunging from $96,...
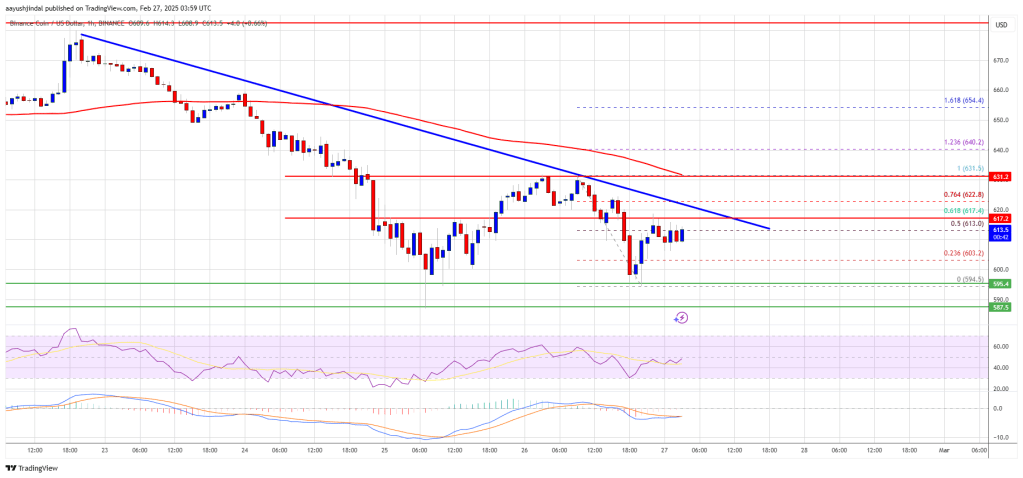
BNB Price Shows Strength—Is a Comeback in Play? https://www.newsbtc.com/analysis/bnb/bnb-price-shows-strength-622/
BNB price is recovering from the $595 support zone. The price is rising and might aim for a fresh mo...