BNB Price Shows Strength—Is a Comeback in Play?


BNB price is recovering from the $595 support zone. The price is rising and might aim for a fresh move toward the $632 resistance.
- BNB price is moving higher above the $610 resistance zone.
- The price is now trading below $630 and the 100-hourly simple moving average.
- There is a connecting bearish trend line forming with resistance at $618 on the hourly chart of the BNB/USD pair (data source from Binance).
- The pair must stay above the $595 level to start another increase in the near term.
BNB Price Eyes Fresh Upside Break
After forming a base above the $590 level, BNB price started a fresh increase. There was a move above the $600 and $610 resistance levels. It even recovered above the $612 level, beating Ethereum and Bitcoin .
There was a decent move above the 50% Fib retracement level of the downward move from the $632 swing high to the $5995 low. However, the bears seem to be active near the $615 and $618 levels. There is also a connecting bearish trend line forming with resistance at $618 on the hourly chart of the BNB/USD pair.
The price is now trading below $620 and the 100-hourly simple moving average. If there is a fresh increase, the price could face resistance near the $618 level. The next resistance sits near the $622 level or the 76.4% Fib retracement level of the downward move from the $632 swing high to the $5995 low.
A clear move above the $622 zone could send the price higher. In the stated case, BNB price could test $632. A close above the $632 resistance might set the pace for a larger move toward the $650 resistance. Any more gains might call for a test of the $665 level in the near term.
Another Decline?
If BNB fails to clear the $622 resistance, it could start another decline. Initial support on the downside is near the $602 level. The next major support is near the $600 level.
The main support sits at $595. If there is a downside break below the $595 support, the price could drop toward the $588 support. Any more losses could initiate a larger decline toward the $565 level.
Technical Indicators
Hourly MACD – The MACD for BNB/USD is gaining pace in the bullish zone.
Hourly RSI (Relative Strength Index) – The RSI for BNB/USD is currently below the 50 level.
Major Support Levels – $600 and $595.
Major Resistance Levels – $622 and $632.

Memecoin Scam Alert: Pump.Fun X Account Hacked, Promotes Fake PUMP Token https://www.newsbtc.com/news/memecoin-scam-alert-pump-fun-x-account-hacked-promotes-fake-pump-token/
The Solana-based memecoin Launchpad Pump.fun’s X account has been hacked and used to promote fake cr...
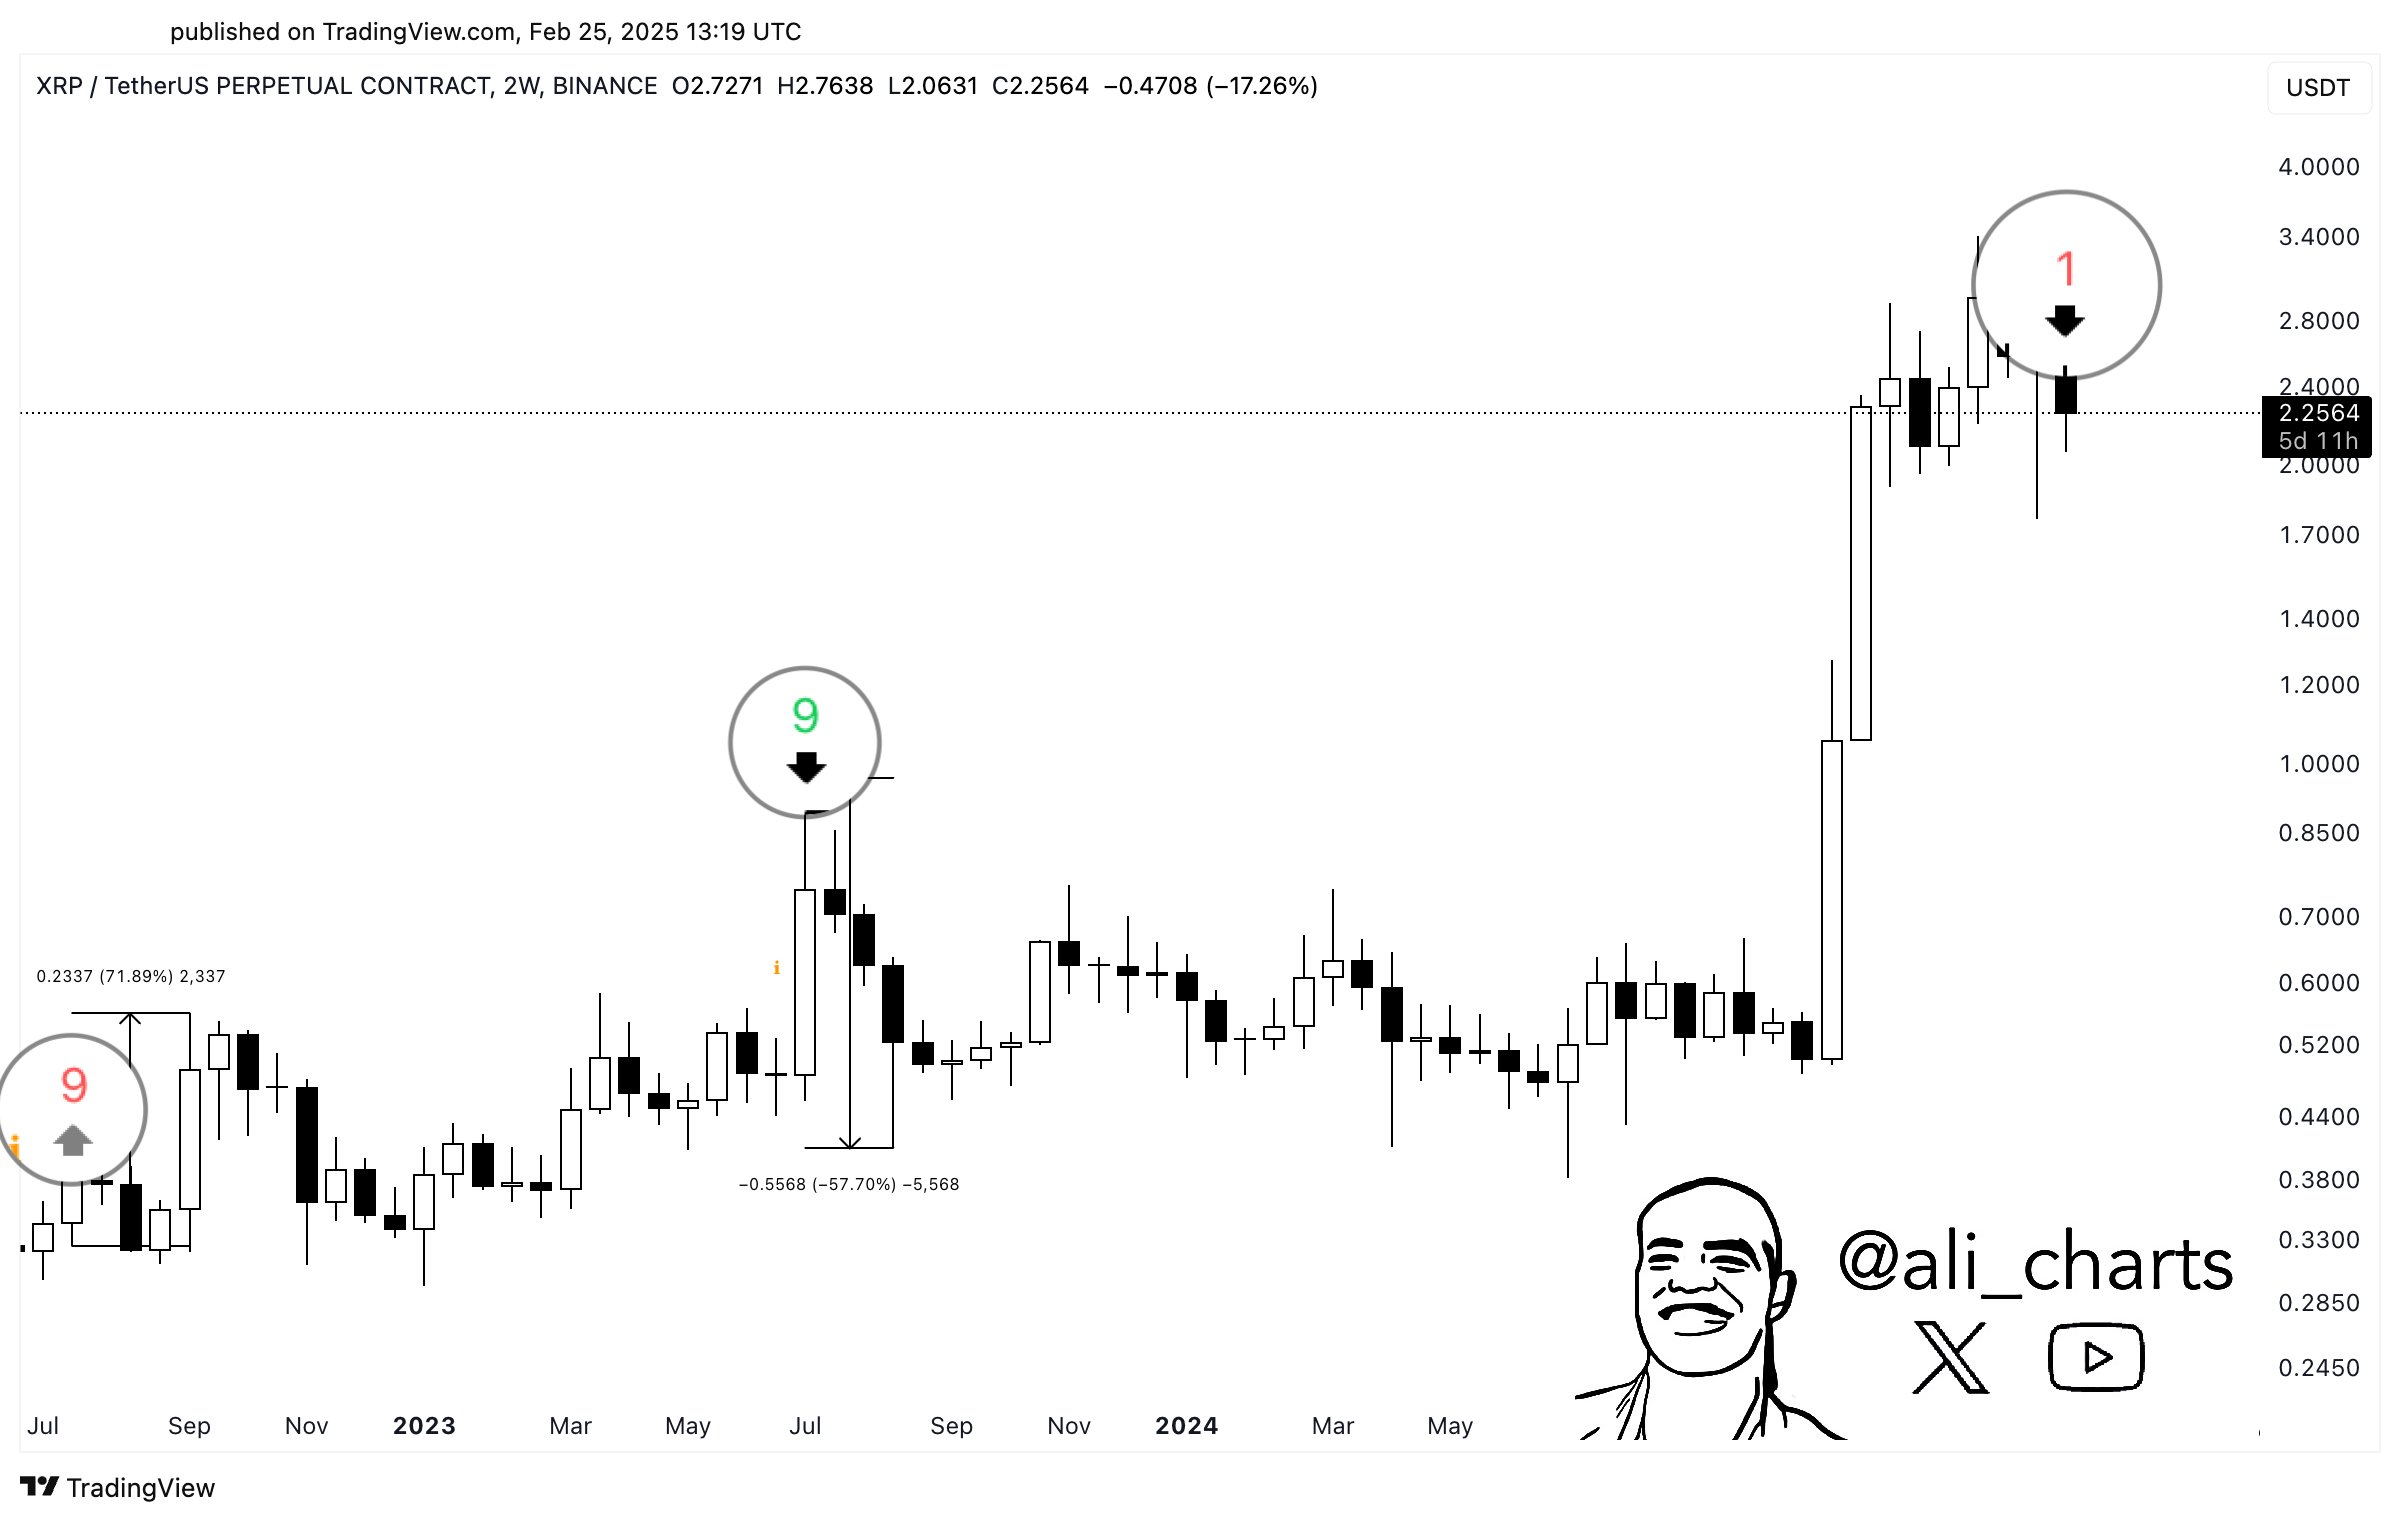
XRP Indicator Reliable Since 2022 Now Gives This Signal https://www.newsbtc.com/xrp-news/xrp-indicator-reliable-since-2022-now-gives-signal/
An analyst has pointed out how the Tom Demark (TD) Sequential has once again formed a signal on the ...
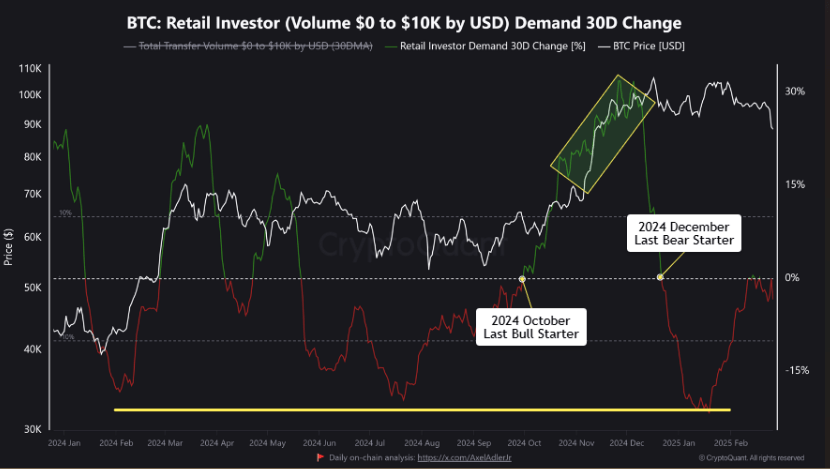
Bitcoin Faces Critical Test as Retail Demand Hits Resistance Levels https://www.newsbtc.com/bitcoin-news/bitcoin-faces-critical-test-as-retail-demand-hits-resistance-levels/
Bitcoin (BTC) is currently trading just below $88,000, a significant drop from its all-time high of ...