ADA Charts Turn Bearish – Technical Indicators Signal More Pain Ahead


Cardano (ADA), once hailed as a top contender in the blockchain space, is now facing a challenging phase as its price charts take a sharp turn for the worse. Over the past few weeks, ADA has struggled to maintain its footing, with technical indicators increasingly pointing to the possibility of further downside
With market sentiment tilting toward caution, traders and investors are closely monitoring ADA’s next moves. Will the current bearish setup trigger a sharper decline, or can ADA stabilize and mount a comeback?
A Breakdown Of Recent Market Movements
Recent market movements for ADA have painted a concerning picture, highlighting a distinct lack of strong bullish momentum . Despite occasional attempts to recover, the altcoin has consistently failed to reclaim crucial resistance zones, leaving the asset vulnerable to more downside.
ADA is showing signs of increasing bearish momentum as the assets have made a negative crossover below the 100-day Simple Moving Average (SMA) a key indicator that often dictates market trends. Sustained trading beneath this level reflects diminishing bullish strength and increases the likelihood of a downtrend.
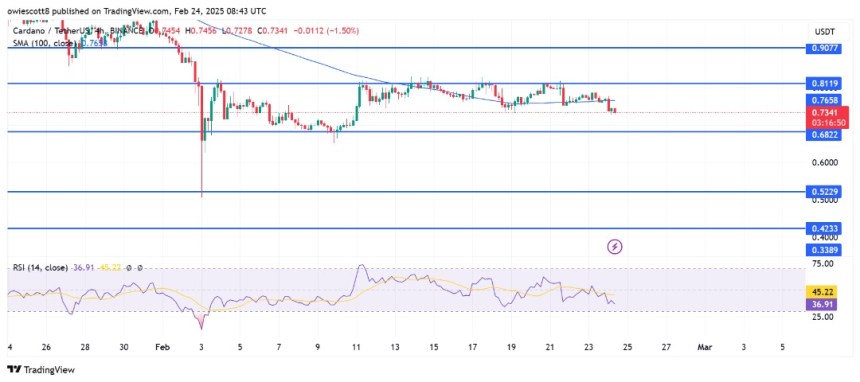
Adding to the concerns, the Relative Strength Index (RSI) is trending downward below the 50% threshold, indicating a decline in buying pressure and a shift toward a bearish trajectory. This weakening demand suggests that sellers are gradually gaining control, making it harder for ADA to stage a recovery. If the RSI continues to decline toward oversold territory, it could reinforce the pessimistic outlook, increasing the risk of a deeper price correction.
ADA’s negative trend is likely to persist should ADA fail to break above the 100-day SMA and the RSI remains below the 50% threshold coupled with rising selling pressure. Typically, this scenario could lead to an extended decrease, pushing the price toward major support levels .
Key Levels To Watch: Where Can ADA Find Support?
As ADA struggles to gain upside momentum, identifying key support levels becomes crucial in assessing potential downside risks and rebound opportunities. With the price trading below the 100-day SMA and bearish sentiment prevailing, market participants are closely watching how the asset reacts to critical price zones.
The first key support to watch lies around $0.6822. If selling pressure persists, retesting this area is probable, where bulls may attempt to defend the price and prevent further declines. A bounce from this level could indicate a short-term recovery.
However, failure to hold the $0.6822 support puts the next major zone to watch at $0.5229, a historically significant level that has served as a key turning point in previous market movements. Losing this support might accelerate the bearish momentum, leading to a deeper correction .

Dogecoin Activity Levels Crash To 4-Month Lows, Does This Spell Doom For The Meme Coin? https://www.newsbtc.com/news/dogecoin/dogecoin-activity-crash/
Crypto analyst Ali Martinez has revealed a bearish on-chain metric for Dogecoin, sparking a negative...
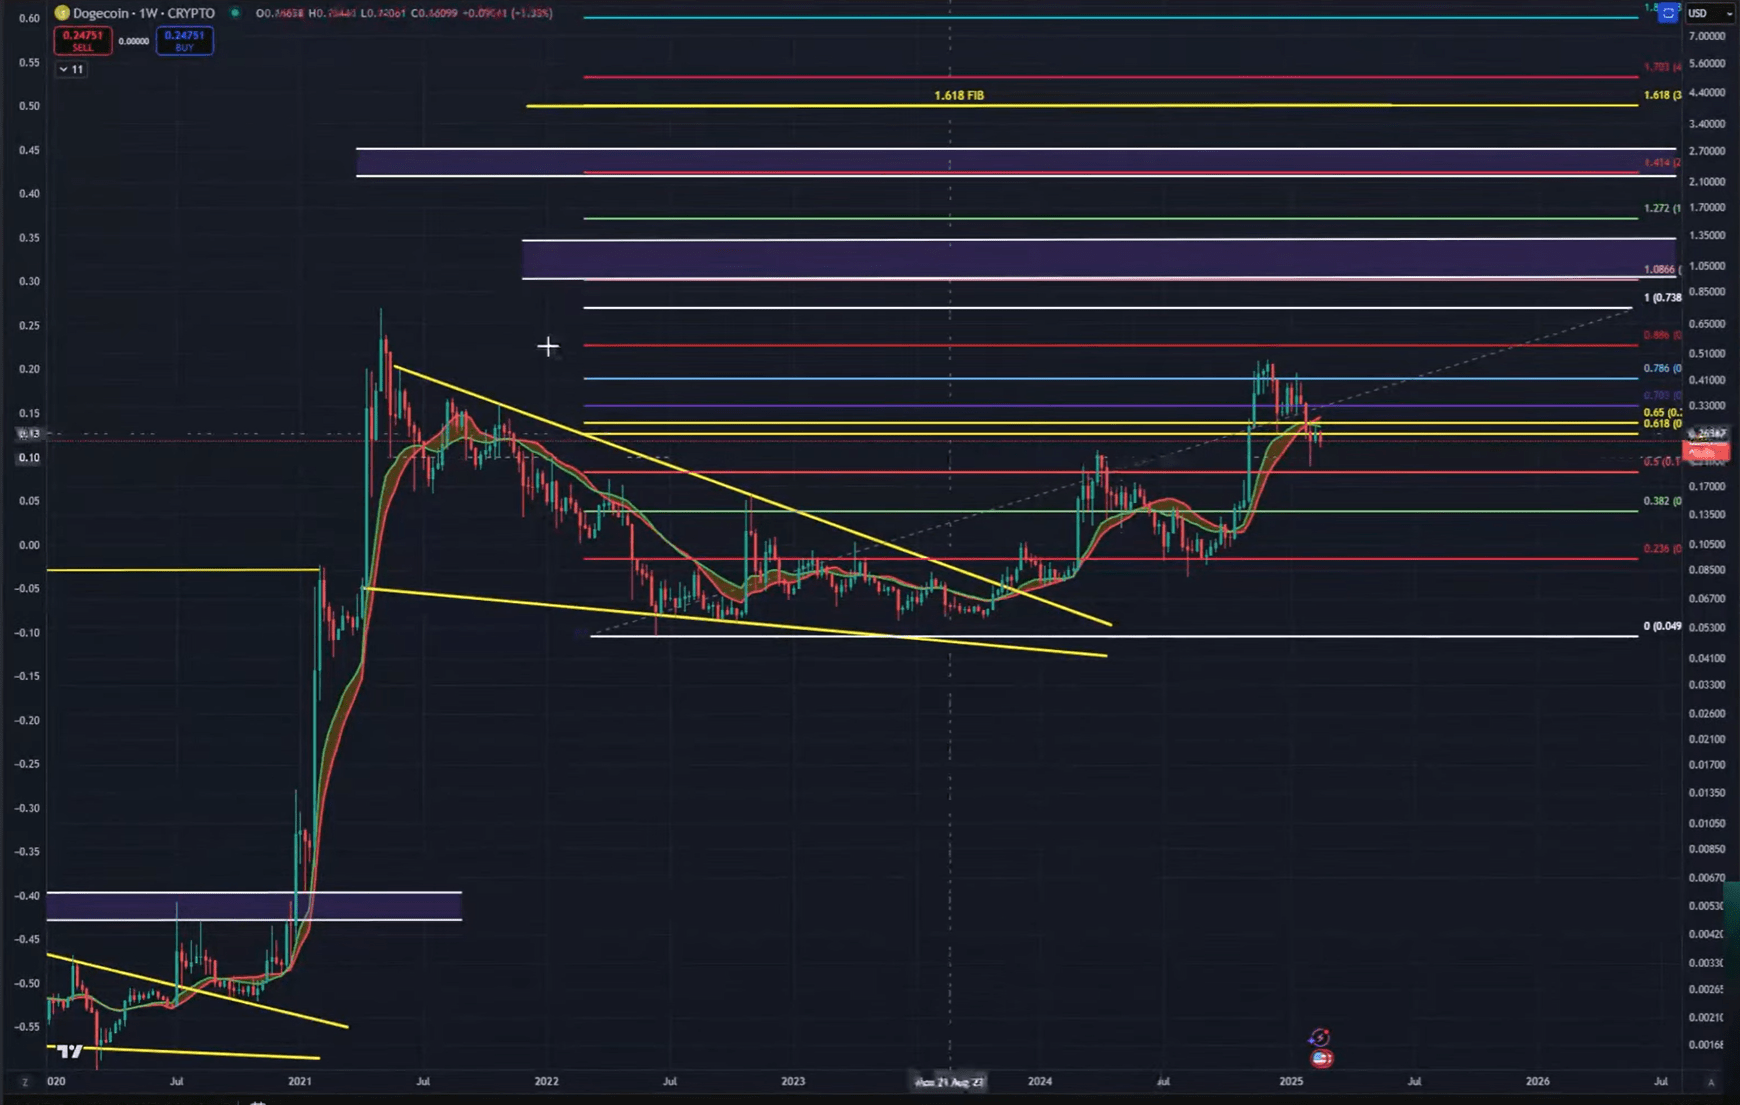
Dogecoin Warning: One Level Could Trigger A Surge, Says Analyst https://www.newsbtc.com/news/dogecoin/dogecoin-warning-one-level-could-trigger-a-surge-says-analyst/
In his latest livestream, crypto chartist Kevin drilled down on Dogecoin’s price action, stressing b...
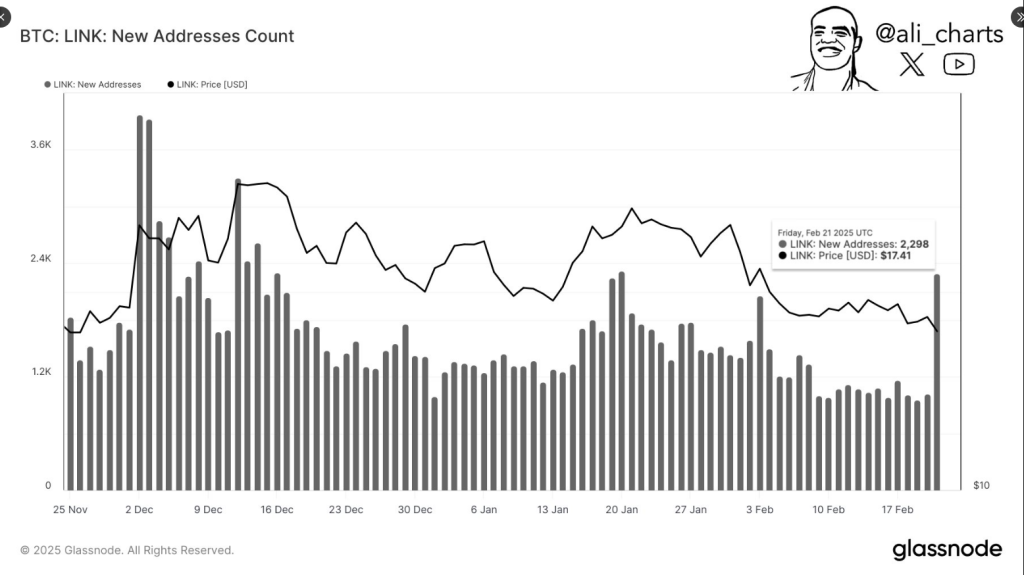
Chainlink Activity Spikes—2,300 Fresh Addresses In Last 7 Weeks https://www.newsbtc.com/news/chainlink-activity-spikes-fresh-addresses-at-7-month-high/
Chainlink (LINK) is proving to be remarkably resilient in a challenging market. The digital asset st...