XRP Price Wobbles at $2.00—Will Bulls Step In to Save The Week?


XRP price started a fresh decline below the $2.250 and $2.20 support levels. The price is now consolidating losses and remains at risk of more losses.
- XRP price started a fresh decline below the $2.250 level.
- The price is now trading below $2.220 and the 100-hourly Simple Moving Average.
- There is a key bearish trend line forming with resistance at $2.20 on the hourly chart of the XRP/USD pair (data source from Kraken).
- The pair might continue to move down unless there is a close above the $2.30 resistance zone.
XRP Price Dips Further
XRP price failed to continue higher above the $2.350 resistance zone and started a fresh decline, like Bitcoin and Ethereum . There was a move below the $2.25 and $2.20 support levels.
The price even dipped below the $2.120 support to enter a bearish zone. A low was formed at $2.0220 and the price is now struggling to stay above $2.0. The price is showing many bearish signs below the 23.6% Fib retracement level of the downward move from the $2.363 swing high to the $2.022 low.
The price is now trading below $2.10 and the 100-hourly Simple Moving Average. On the upside, the price might face resistance near the $2.120 level. The first major resistance is near the $2.20 level or the 50% Fib retracement level of the downward move from the $2.363 swing high to the $2.022 low.
There is also a key bearish trend line forming with resistance at $2.20 on the hourly chart of the XRP/USD pair. The next resistance is $2.30. A clear move above the $2.30 resistance might send the price toward the $2.350 resistance. Any more gains might send the price toward the $2.420 resistance or even $2.450 in the near term. The next major hurdle for the bulls might be $2.50.
More Losses?
If XRP fails to clear the $2.20 resistance zone, it could start another decline. Initial support on the downside is near the $2.020 level. The next major support is near the $2.00 level.
If there is a downside break and a close below the $2.00 level, the price might continue to decline toward the $1.9650 support. The next major support sits near the $1.880 zone.
Technical Indicators
Hourly MACD – The MACD for XRP/USD is now gaining pace in the bearish zone.
Hourly RSI (Relative Strength Index) – The RSI for XRP/USD is now below the 50 level.
Major Support Levels – $2.020 and $2.00.
Major Resistance Levels – $2.20 and $2.30.
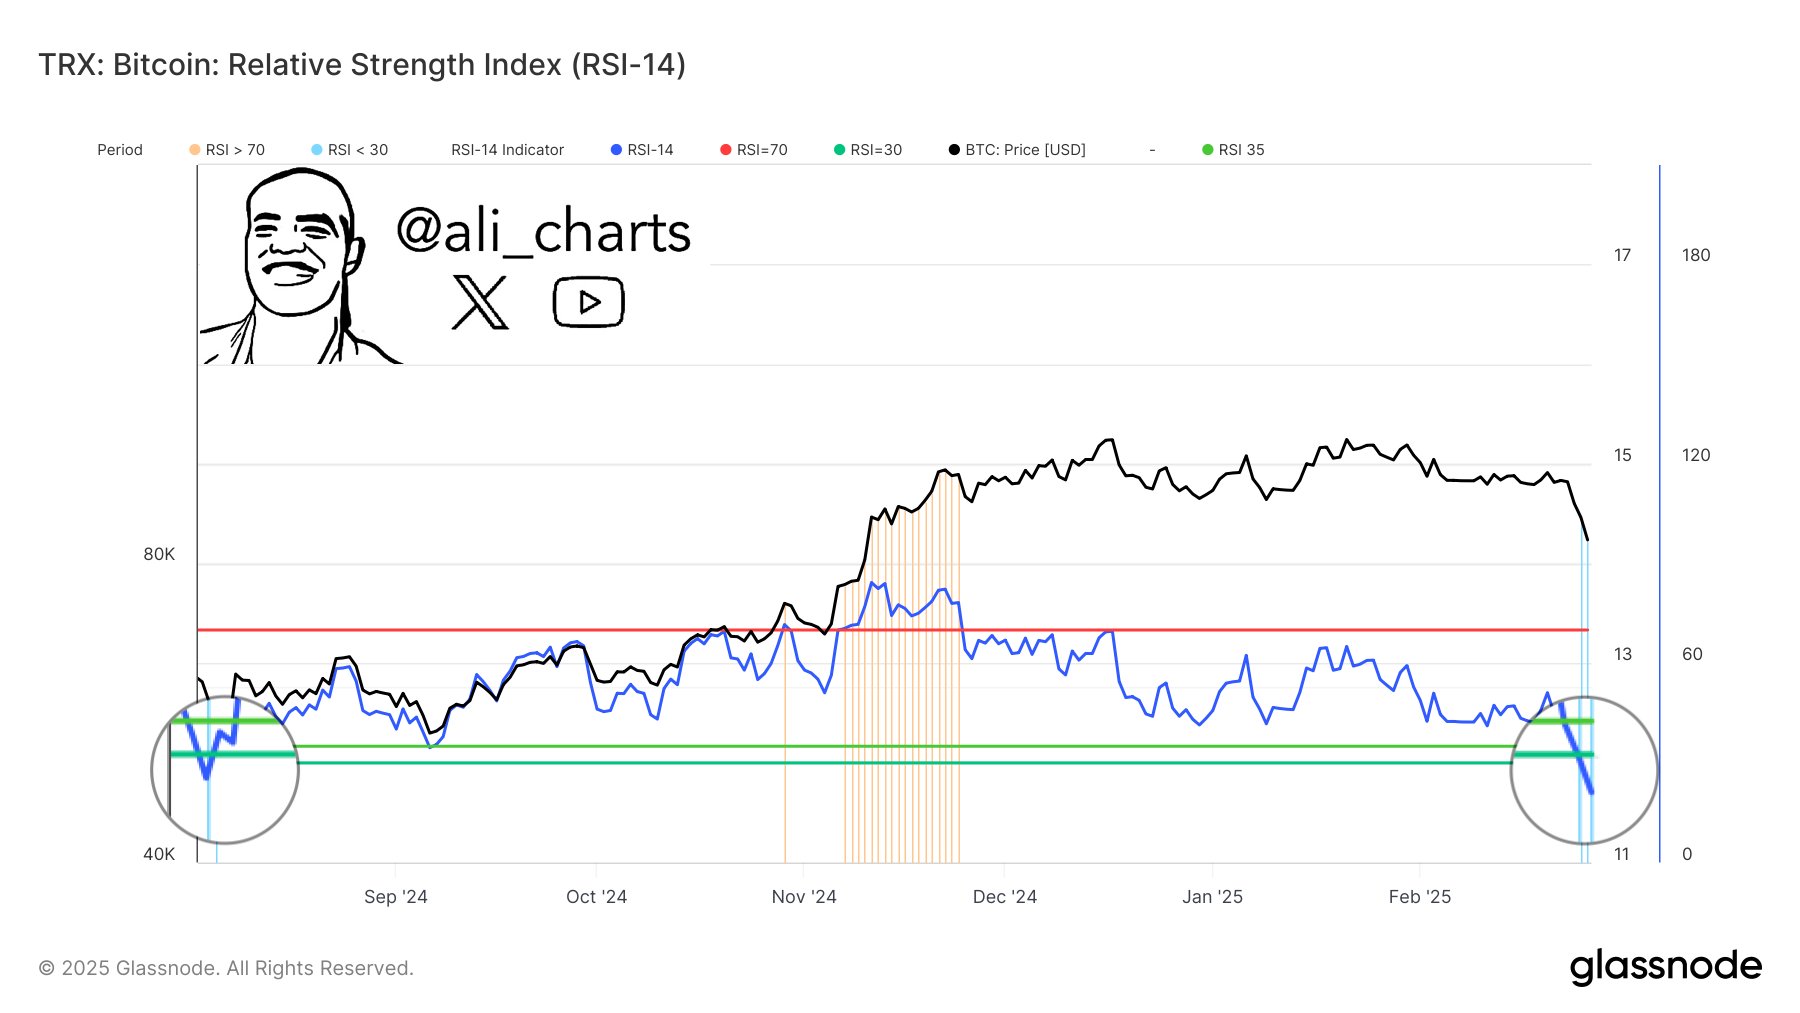
Bitcoin Hits Its Most Oversold Level Since August 2024 – Is A Rebound Coming? https://www.newsbtc.com/bitcoin-news/bitcoin-hits-its-most-oversold-level-since-august-2024-is-a-rebound-coming/
Bitcoin (BTC) has declined by more than 10% in the last two weeks, falling from approximately $98,00...

Bitcoin Miners Are Hoarding Their Crypto Despite Plunge—Here’s What It Means https://www.newsbtc.com/bitcoin-news/bitcoin-miners-are-hoarding-their-crypto-despite-plunge-heres-what-it-means/
Bitcoin has faced a challenging market environment, with its price remaining below $88,000 and regis...
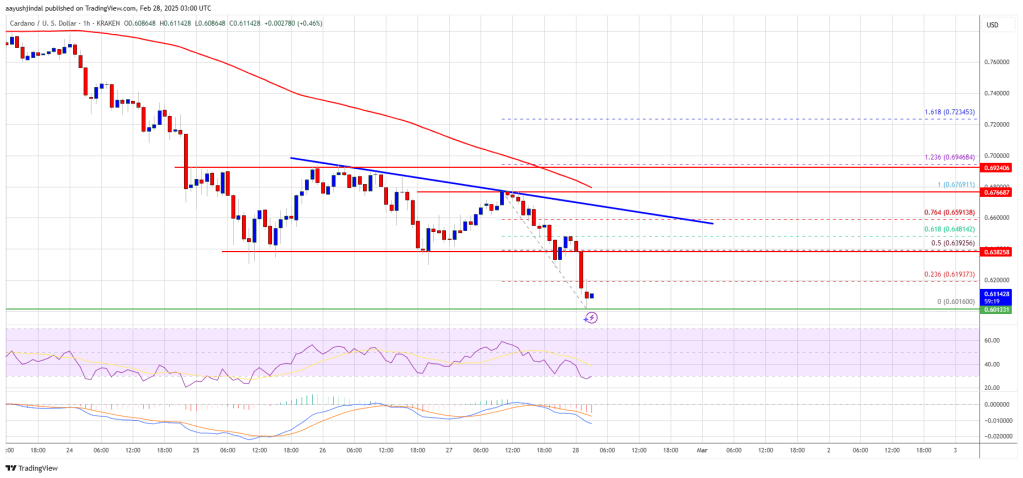
Cardano (ADA) Under Pressure: Bears Target $0.50 Breakdown https://www.newsbtc.com/analysis/ada/cardano-ada-under-pressure-0-60/
Cardano price started a fresh decline from the $0.70 zone. ADA is now consolidating losses and at ri...