Bitcoin Price Recovers Some Losses—Is a Full Rebound in Sight?


Bitcoin price started a fresh decline below the $86,000 zone. BTC is now correcting losses and might struggle near the $84,000 and $85,000 levels.
- Bitcoin started a fresh decline below the $85,000 zone.
- The price is trading below $84,000 and the 100 hourly Simple moving average.
- There was a break above a key bearish trend line with resistance at $82,000 on the hourly chart of the BTC/USD pair (data feed from Kraken).
- The pair could start another decline if it fails to clear the $84,000 resistance zone.
Bitcoin Price Faces Resistance
Bitcoin price started a fresh decline below the $85,000 level. BTC traded below the $82,000 and $80,000 support levels. Finally, the price tested the $76,500 support zone.
A low was formed at $76,818 and the price recently started a recovery wave. There was a move above the $78,000 and $80,000 resistance levels. The bulls pushed the price above the 23.6% Fib retracement level of the downward move from the $91,060 swing high to the $76,818 low.
There was a break above a key bearish trend line with resistance at $82,000 on the hourly chart of the BTC/USD pair. Bitcoin price is now trading below $84,000 and the 100 hourly Simple moving average. On the upside, immediate resistance is near the $83,200 level. The first key resistance is near the $84,000 level.
The 50% Fib retracement level of the downward move from the $91,060 swing high to the $76,818 low is also near $84,000. The next key resistance could be $85,000.
A close above the $85,000 resistance might send the price further higher. In the stated case, the price could rise and test the $86,500 resistance level. Any more gains might send the price toward the $88,000 level or even $96,200.
Another Drop In BTC?
If Bitcoin fails to rise above the $84,000 resistance zone, it could start a fresh decline. Immediate support on the downside is near the $81,200 level. The first major support is near the $80,000 level.
The next support is now near the $78,000 zone. Any more losses might send the price toward the $76,500 support in the near term. The main support sits at $75,000.
Technical indicators:
Hourly MACD – The MACD is now losing pace in the bullish zone.
Hourly RSI (Relative Strength Index) – The RSI for BTC/USD is now above the 50 level.
Major Support Levels – $81,000, followed by $80,000.
Major Resistance Levels – $84,000 and $85,000.
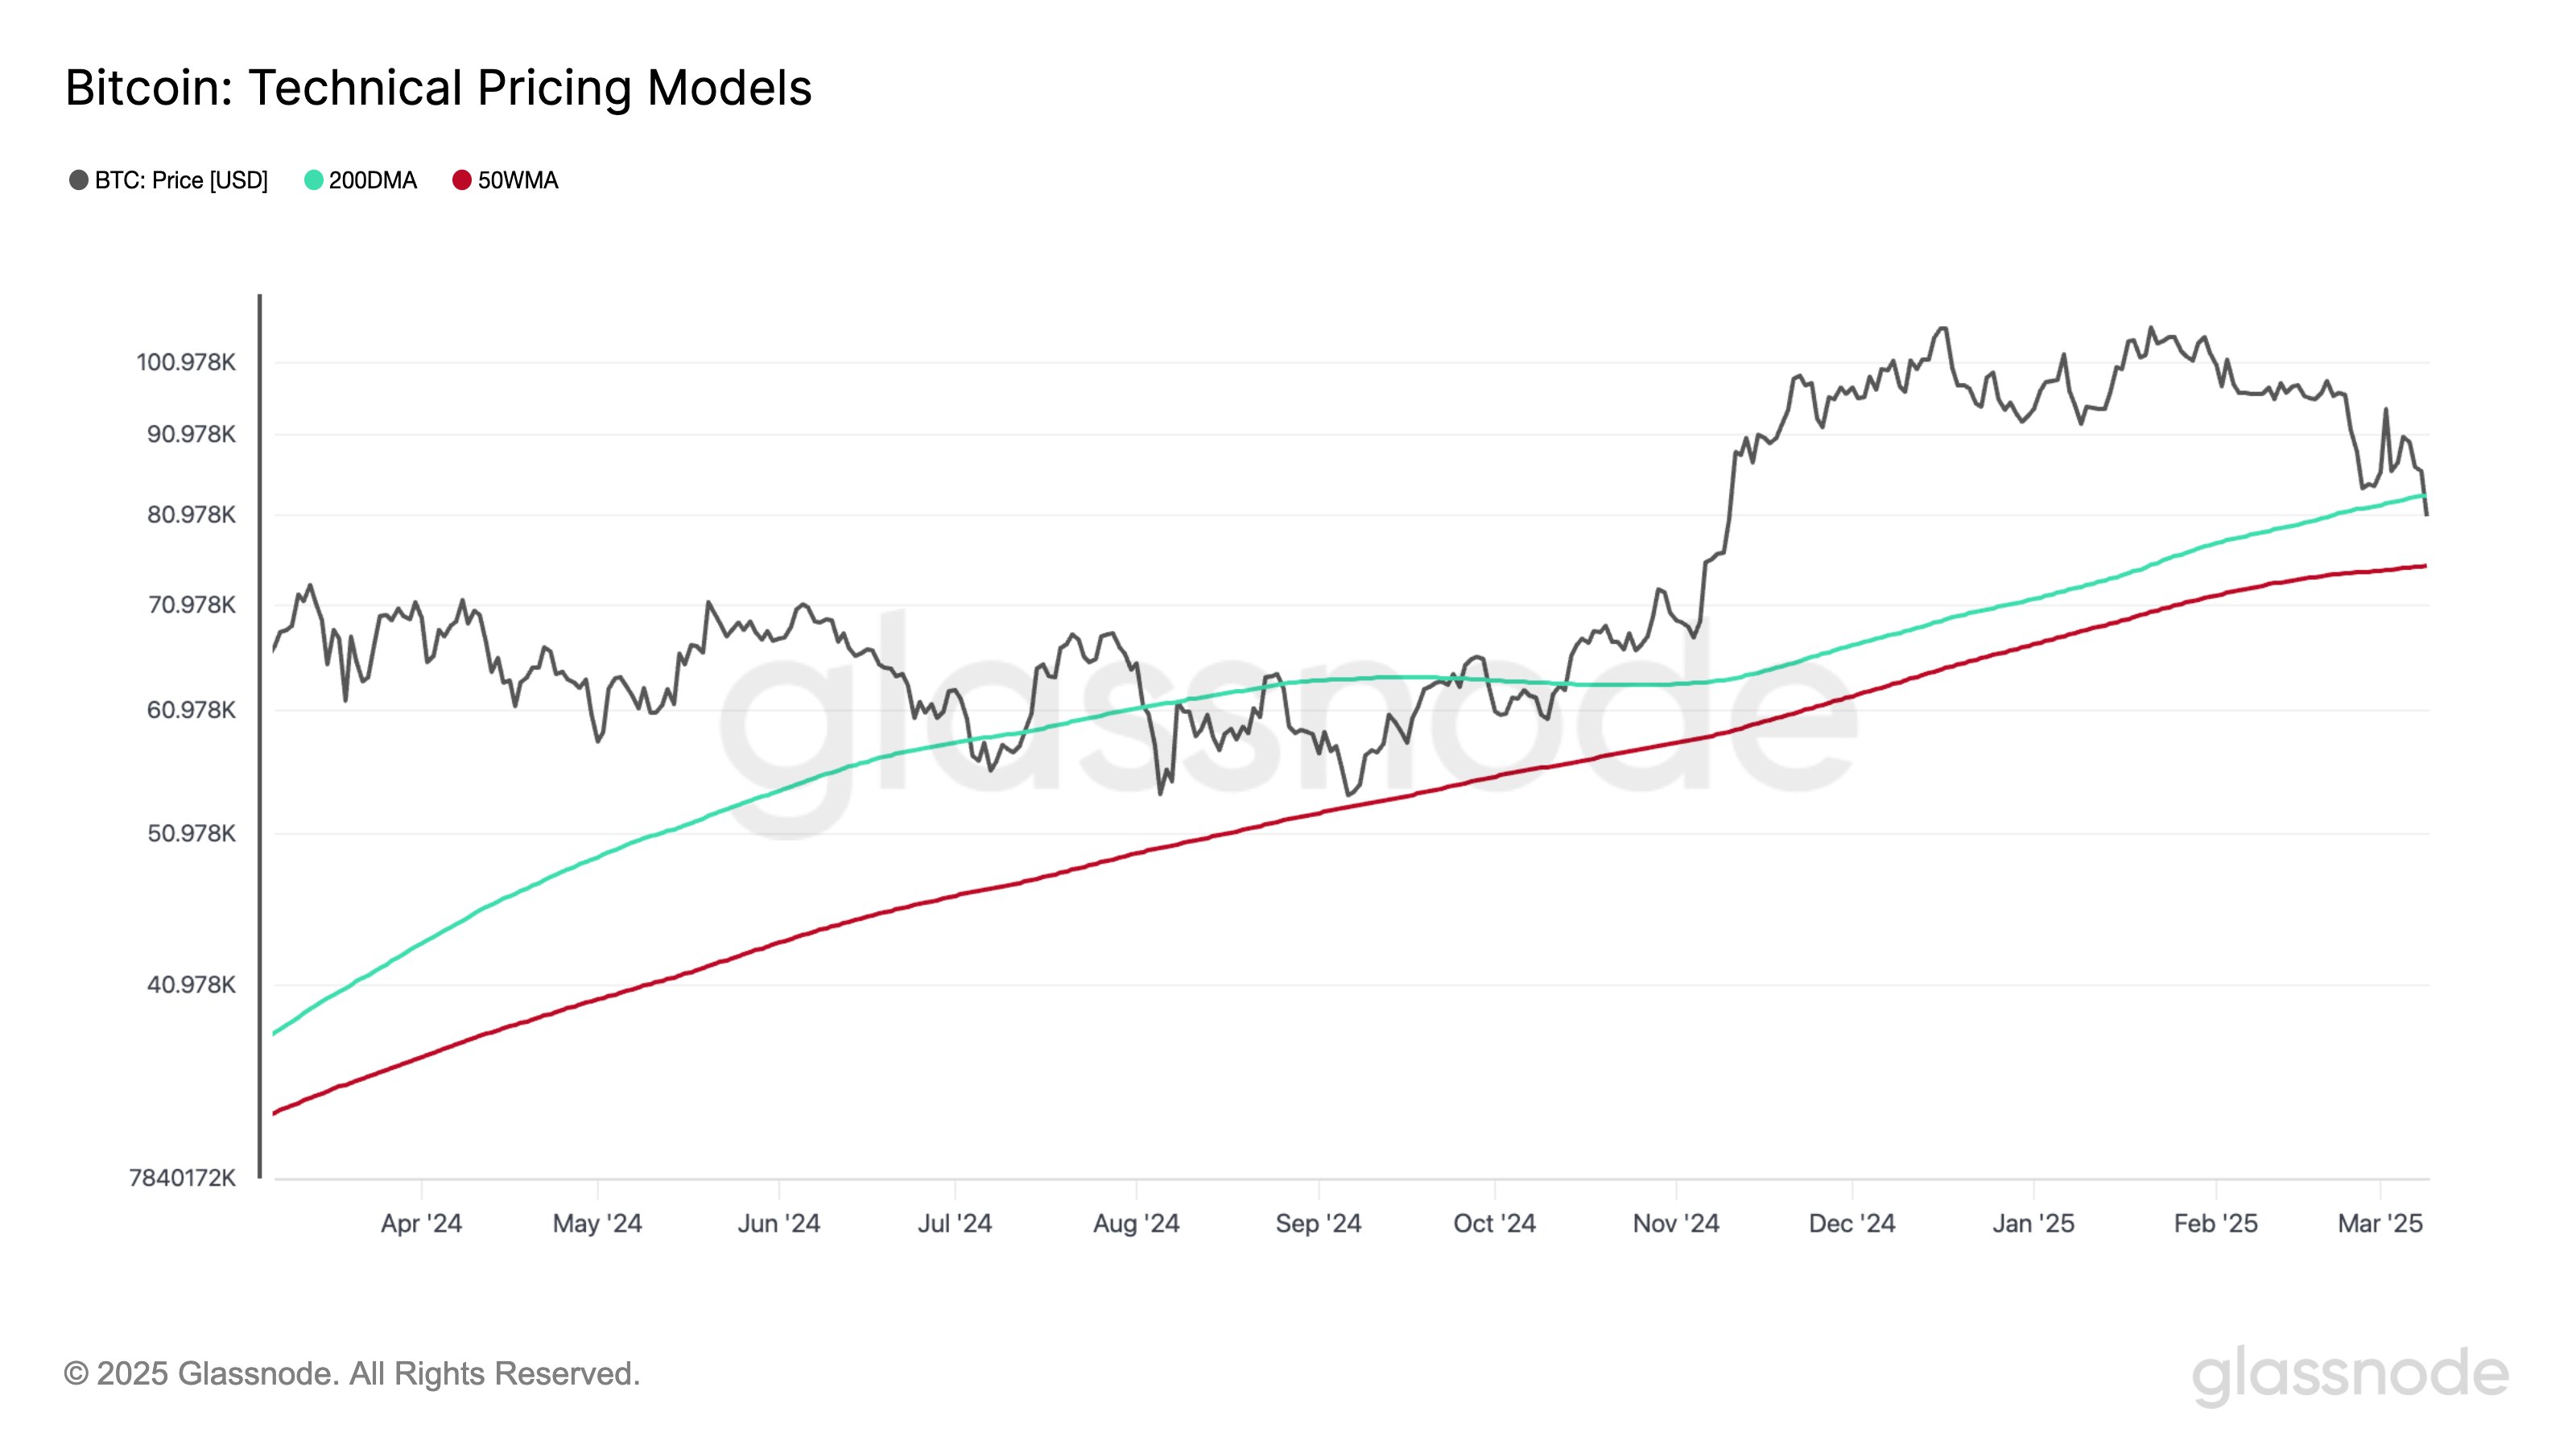
Bitcoin Bear Market Is Below This Level, Analyst Reveals
An analyst has explained how a moving average (MA) that has historically served as the boundary for ...
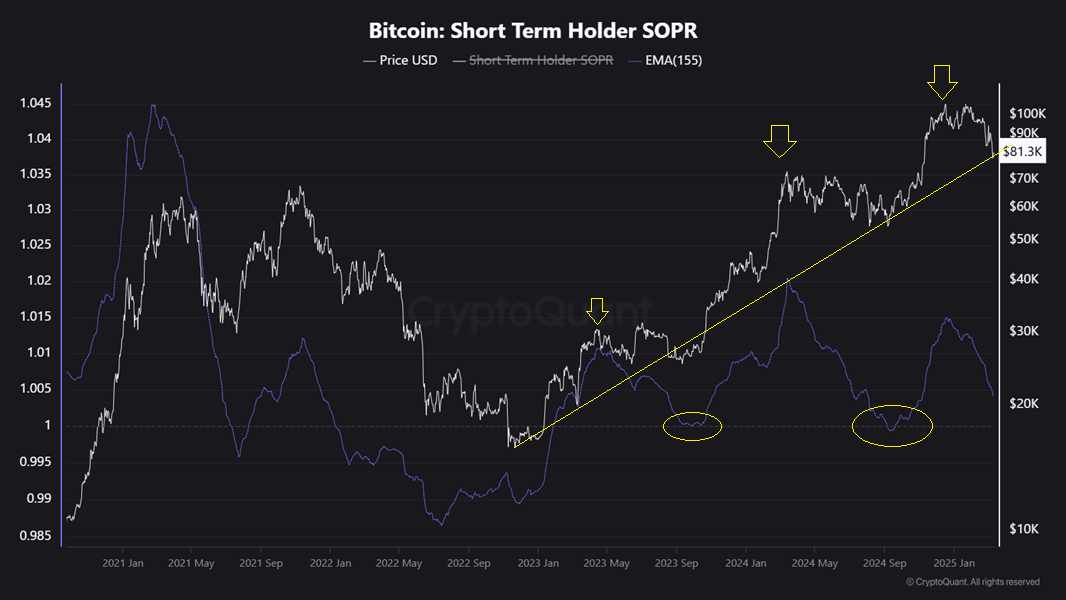
Bitcoin’s SOPR Nears Critical Level—Is a Deeper Correction Ahead?
Bitcoin’s price has continued its gradual decline, now trading just above $81,000, marking a signifi...
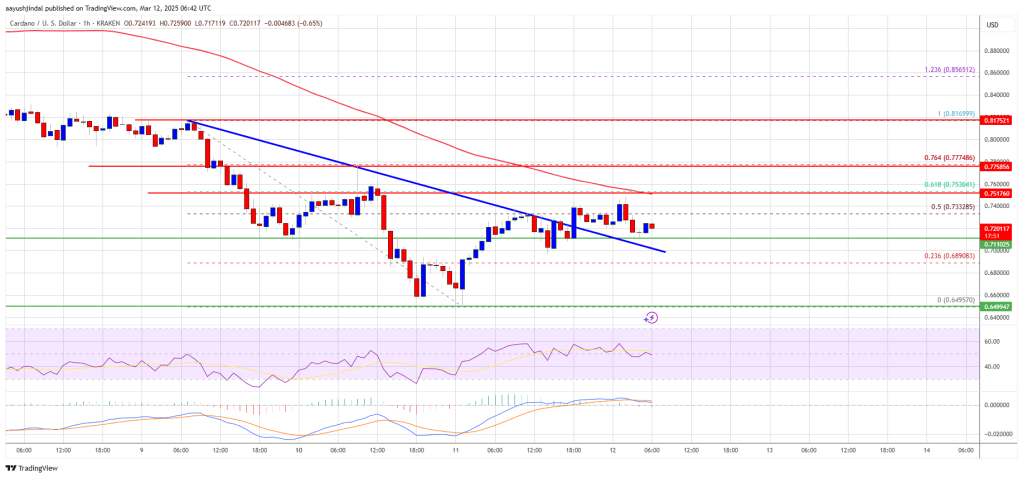
Cardano Struggles to Climb—ADA Faces Strong Hurdles Ahead
Cardano price started a fresh decline below the $0.75 zone. ADA is correcting some losses and might ...