Historical Pattern From 2020 Hints Ethereum Could Be Poised For A Parabolic Rally, Analysts Explain


According to an X post by crypto analyst Mister Crypto, Ethereum (ETH) could be on the verge of a massive rally. The analyst highlighted similarities between the current ETH price action and that of 2020, following the COVID market crash.
Ethereum On The Cusp Of Trend Reversal?
Ethereum’s subdued price action may soon come to an end, as multiple analysts point toward a potential trend reversal for the second-largest cryptocurrency by reported market cap. Analyst Mister Crypto shared the following chart, outlining the similar chart patterns.
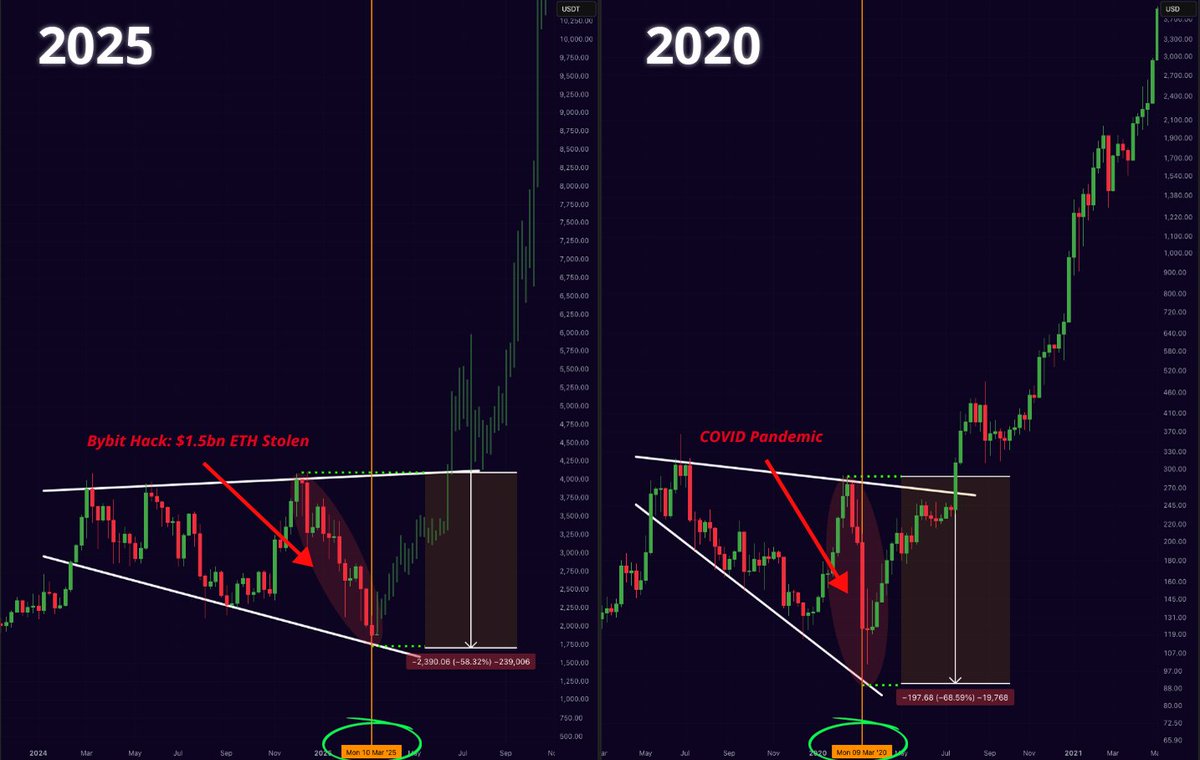
In the chart, the analyst illustrates how ETH is currently forming a price pattern similar to what was observed during the COVID pandemic in 2020. At that time, ETH experienced a sharp trend reversal to the upside following the infamous March 2020 crash.
Similarly, ETH may be preparing to resume bullish momentum after the recent Bybit exchange hack. For the uninitiated, the Bybit crypto exchange hack resulted in ETH worth $1.5 billion being stolen.
Mister Crypto’s thoughts were echoed by fellow crypto analyst Merlijn The Trader. In a separate X post, the analyst stated that ETH is likely repeating its historical cycle, which typically sees capitulation before a massive run-up.

In addition to the COVID crash, the analyst highlighted the Luna crash of 2022 as another instance when bearish sentiment surrounding ETH was at its peak. However, the digital asset quickly overcame the pessimism, going on to experience a massive 270% rally.
Multiple Indicators Point Toward ETH Rally
Beyond the bullish historical patterns, multiple indicators suggest a potential rally for ETH. In an X post , crypto analyst TraderPA remarked that Ethereum is currently oversold at its present price and that the weekly Stochastic Relative Strength Index (RSI) is signaling a potential rebound.
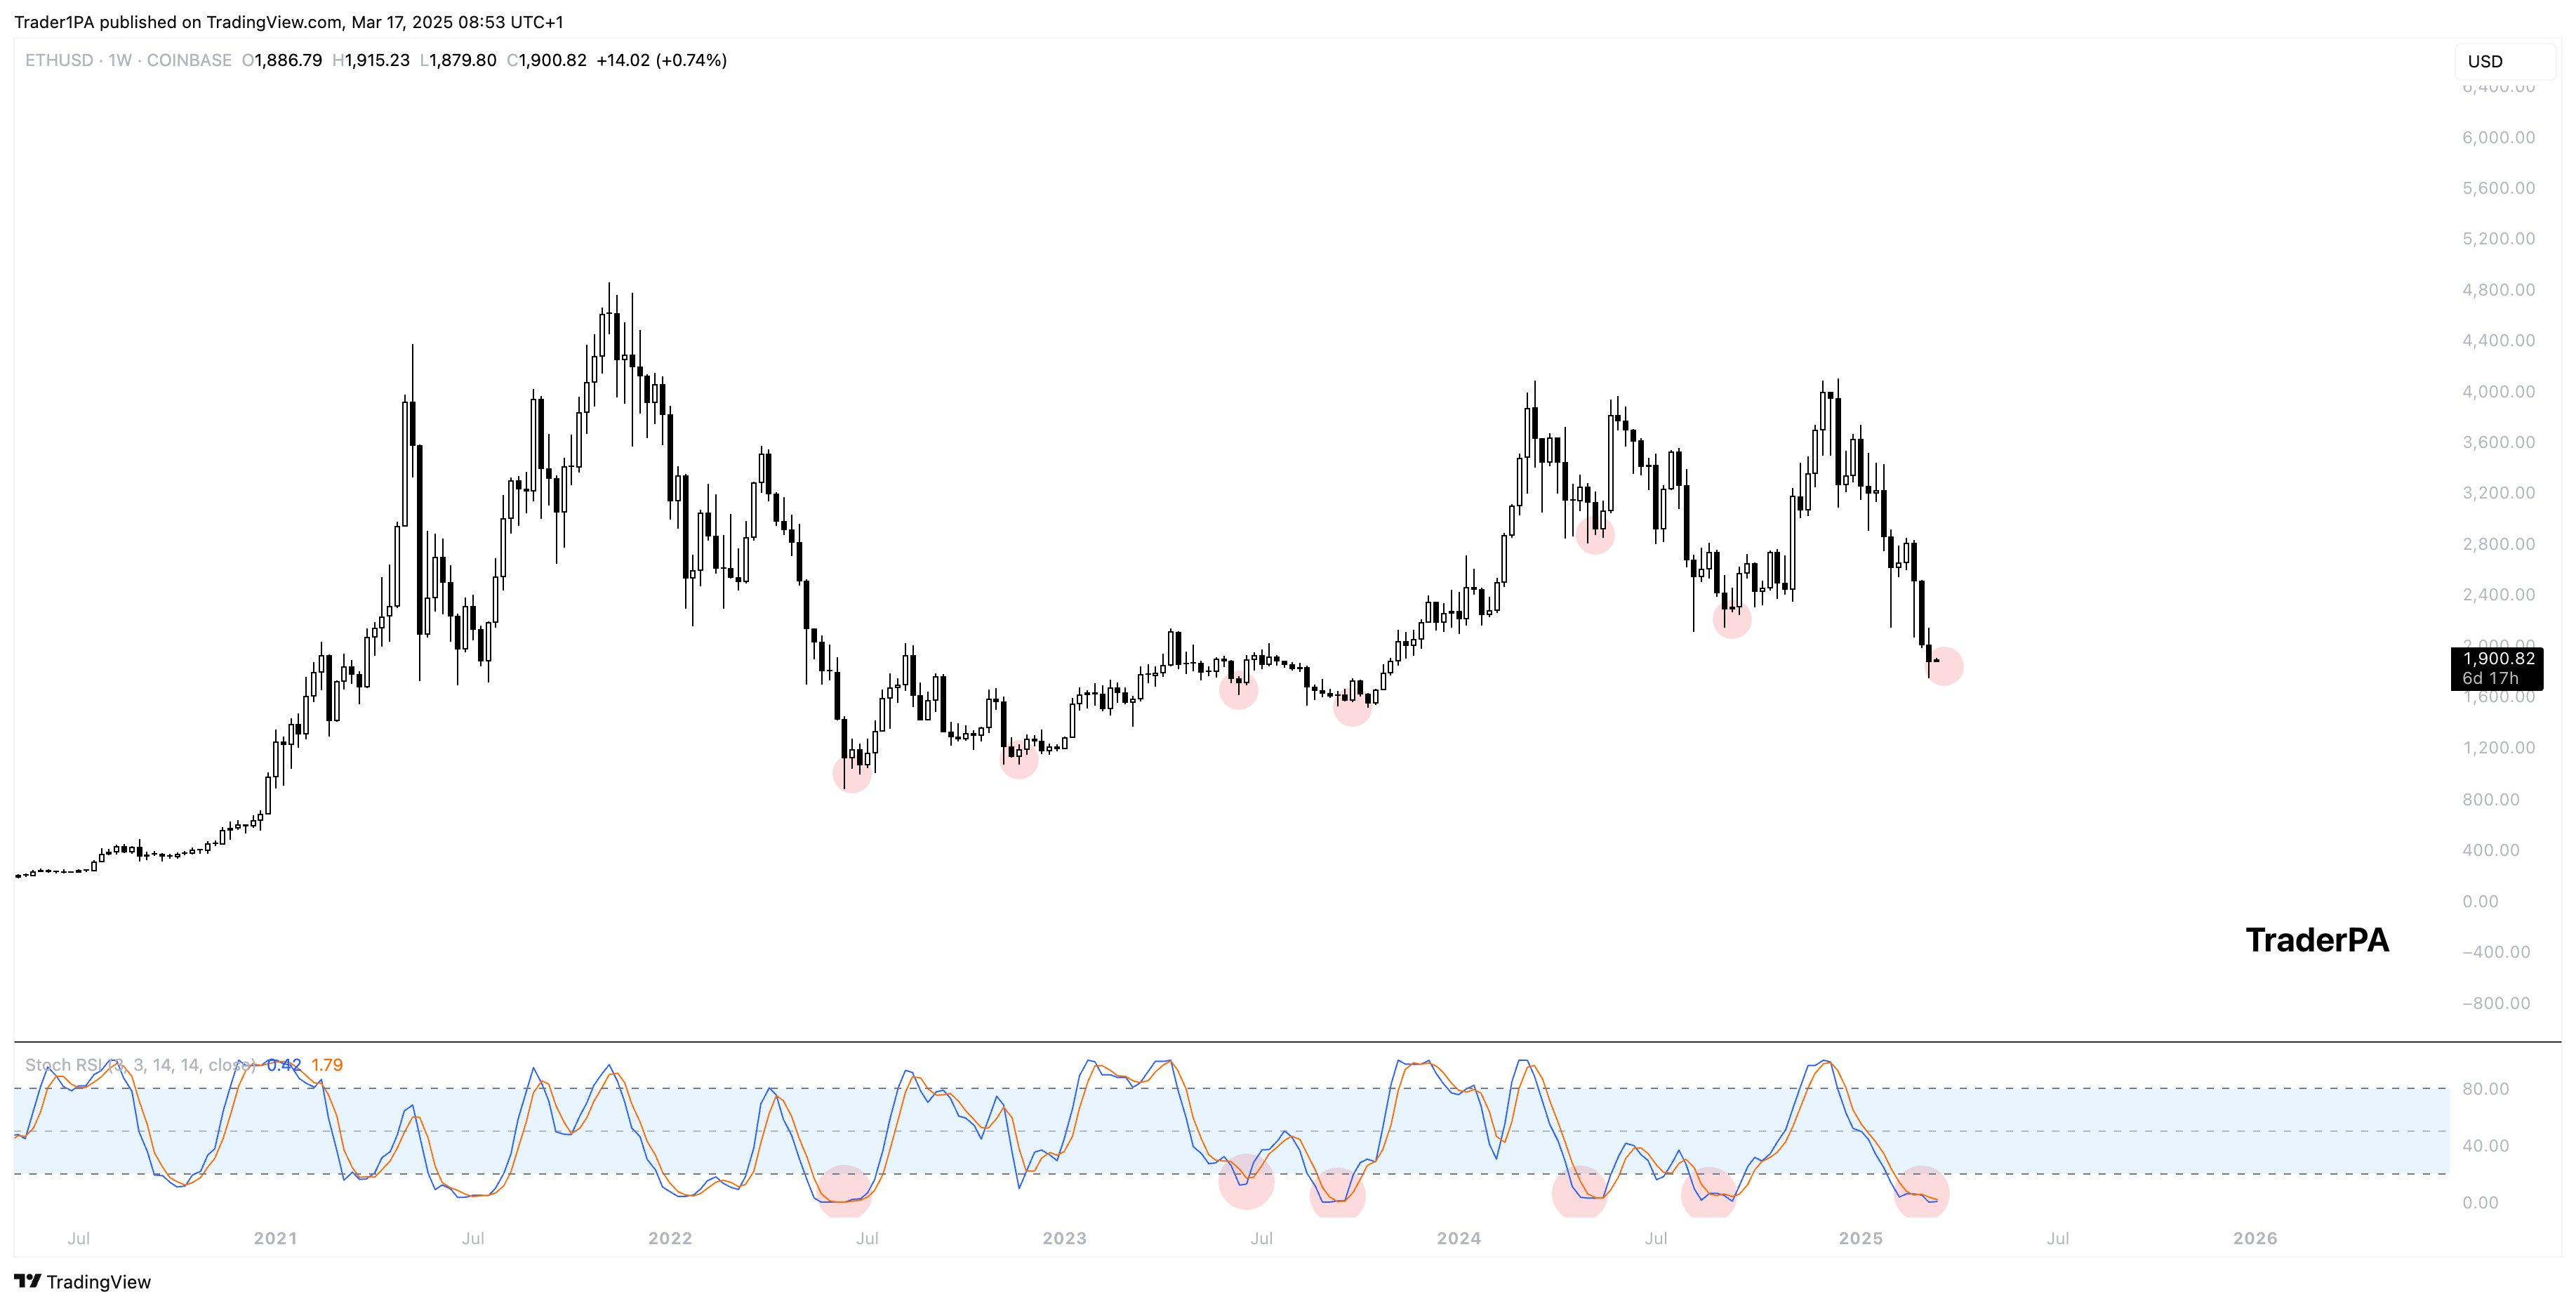
To explain, the weekly Stochastic RSI is a momentum indicator that measures the relative position of an asset’s current price within its recent price range over a week. When the fast line (blue) crosses above the slow line (orange) in the oversold zone, it signals potential upward momentum, indicating a buying opportunity.
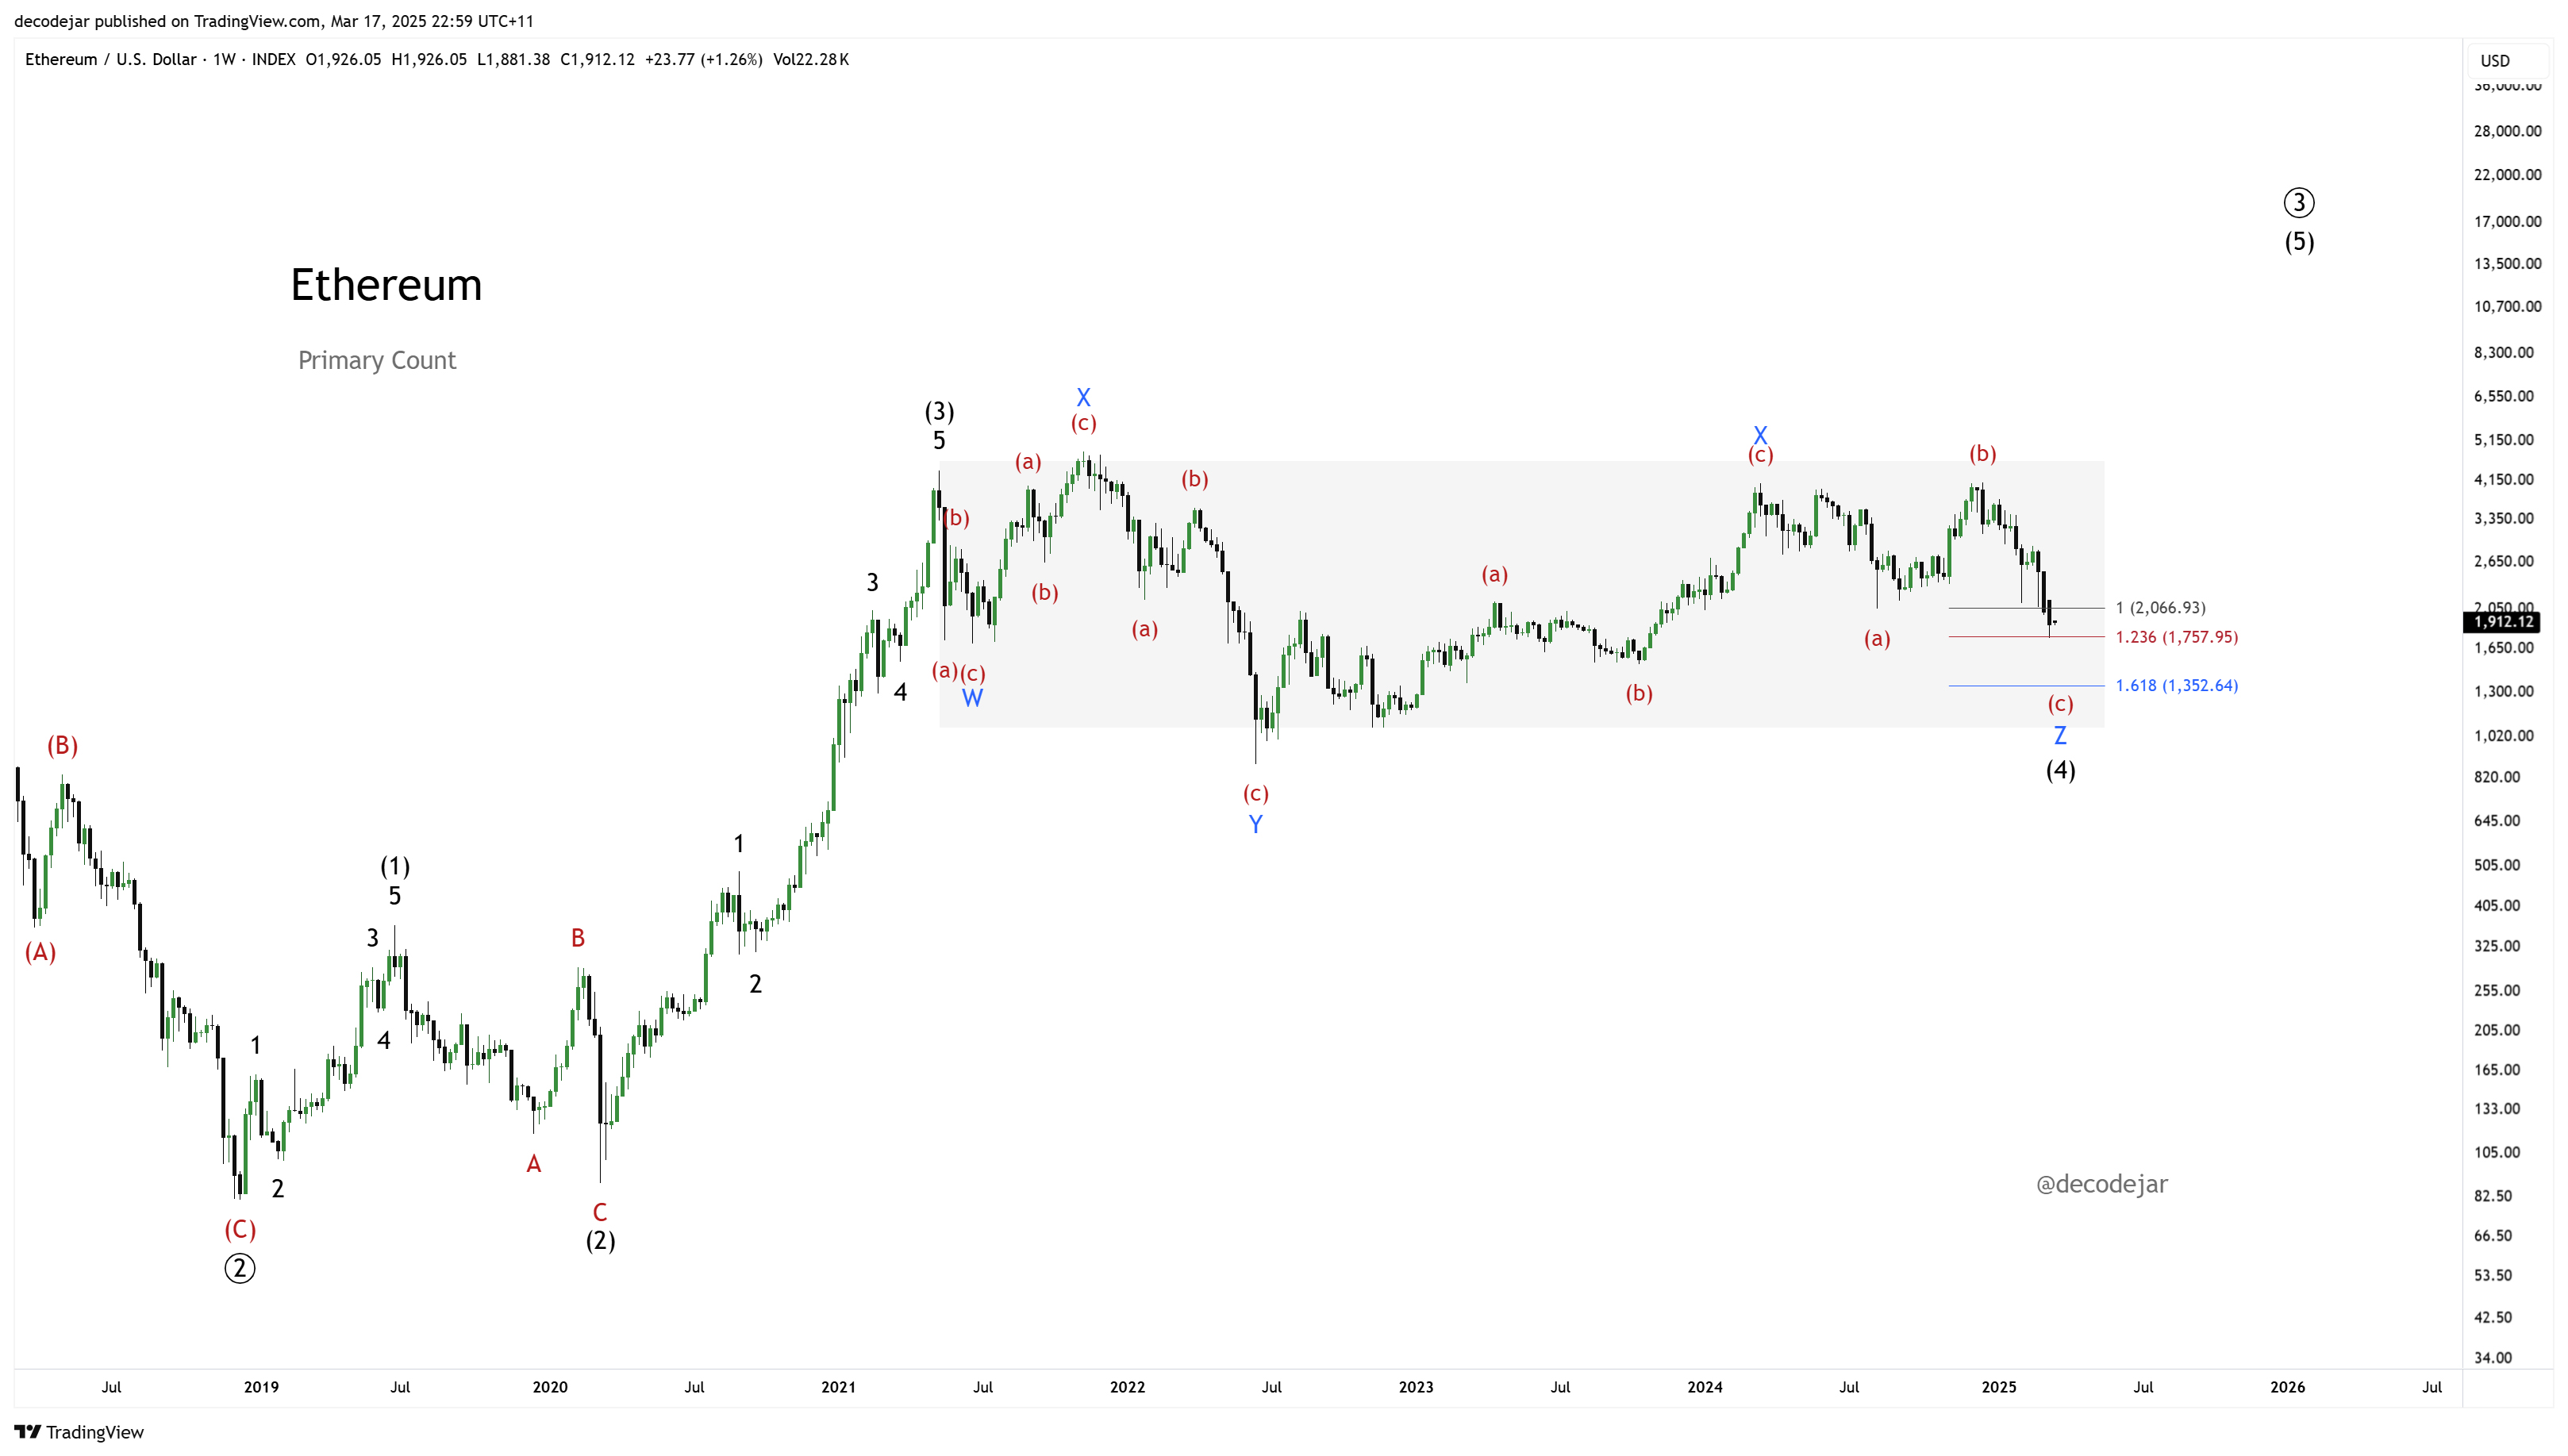
Furthermore, crypto analyst Decode highlighted the importance of Elliott Wave Theory in predicting ETH’s price momentum. The analyst explained:
Sentiment on Ethereum is bearish beyond anything I have ever seen, so whilst lower targets are still available, it’s possible we’ve done enough at the 1.236 extension of C vs A to complete this wave 4. The eventual reversal will be the most hated rally ever seen in crypto.
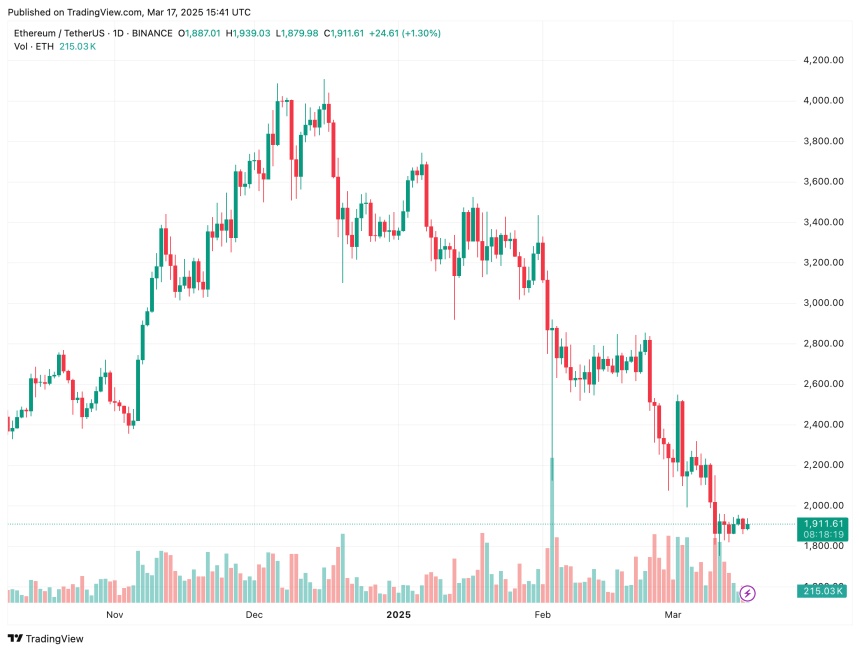
That said, rising ETH exchange reserves could delay any quick price recovery. At press time, ETH trades at $1,911, up 0.9% in the past 24 hours.
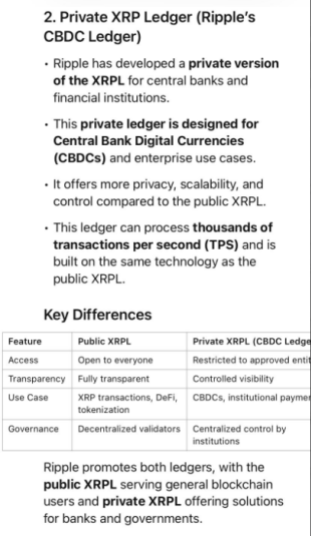
XRP Puzzle: London Fund Manager Breaks Down Why Price Isn’t Rising
Banks and other global financial organizations are becoming more interested in XRP, the cryptocurren...
Best Crypto to Buy as Canary Capital Files for First-Ever SUI ETF
The best crypto to buy are now shining stronger that the SEC has acknowledged the filing of the firs...
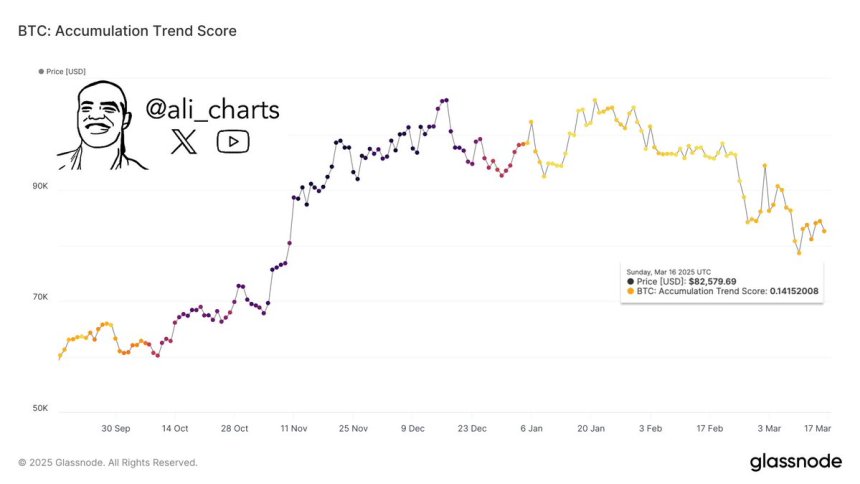
Bitcoin Accumulation Resumes After 3 Months Of Distribution – Analyst
Bitcoin (BTC) continues to trade below the $85K level, fueling fears of further downside as the bear...