Dogecoin (DOGE) Faces Market Correction—Will Buyers Step Back In?


Dogecoin started a fresh decline from the $0.2050 zone against the US Dollar. DOGE is declining and might test the $0.180 support zone.
- DOGE price started a fresh decline below the $0.1980 and $0.1920 levels.
- The price is trading above the $0.180 level and the 100-hourly simple moving average.
- There was a break below a connecting bullish trend line with support at $0.1950 on the hourly chart of the DOGE/USD pair (data source from Kraken).
- The price could gain bullish momentum if it clears the $0.1940 and $0.1980 resistance levels.
Dogecoin Price Dips Again
Dogecoin price started a fresh decline after it failed to clear $0.2050, like Bitcoin and Ethereum . DOGE dipped below the $0.1980 and $0.1920 support levels.
The bears were able to push the price below the 23.6% Fib retracement level of the upward move from the $0.1665 swing low to the $0.2057 high. There was also a break below a connecting bullish trend line with support at $0.1950 on the hourly chart of the DOGE/USD pair.
Dogecoin price is now trading above the $0.180 level and the 100-hourly simple moving average. Immediate resistance on the upside is near the $0.1920 level.
The first major resistance for the bulls could be near the $0.1980 level. The next major resistance is near the $0.2050 level. A close above the $0.2050 resistance might send the price toward the $0.2150 resistance. Any more gains might send the price toward the $0.2220 level. The next major stop for the bulls might be $0.2350.
More Losses In DOGE?
If DOGE’s price fails to climb above the $0.1920 level, it could start another decline. Initial support on the downside is near the $0.1860 level and the 50% Fib retracement level of the upward move from the $0.1665 swing low to the $0.2057 high. The next major support is near the $0.1820 level.
The main support sits at $0.1750. If there is a downside break below the $0.1750 support, the price could decline further. In the stated case, the price might decline toward the $0.170 level or even $0.1650 in the near term.
Technical Indicators
Hourly MACD – The MACD for DOGE/USD is now losing momentum in the bullish zone.
Hourly RSI (Relative Strength Index) – The RSI for DOGE/USD is now below the 50 level.
Major Support Levels – $0.1860 and $0.1820.
Major Resistance Levels – $0.1920 and $0.1980.
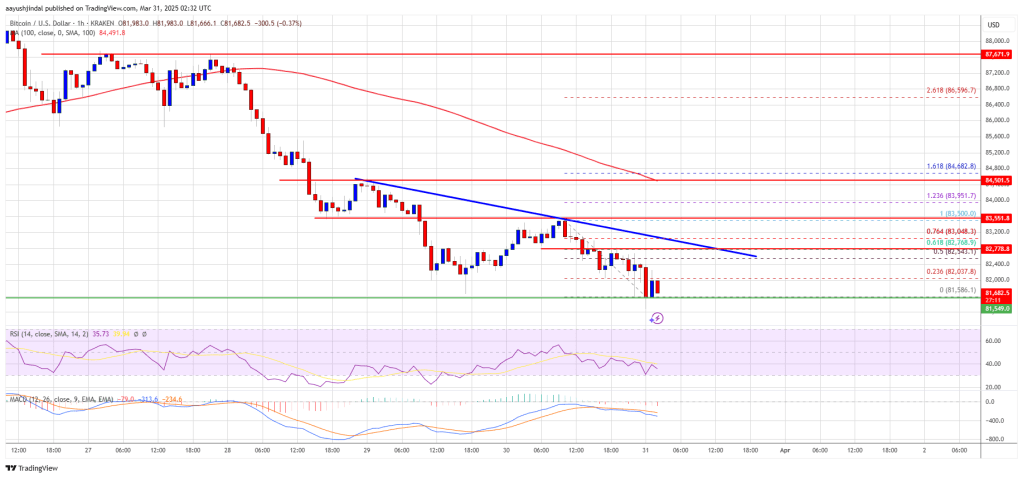
Bitcoin Bears Tighten Grip—Where’s the Next Support?
Bitcoin price started another decline below the $85,000 zone. BTC is now consolidating and might str...
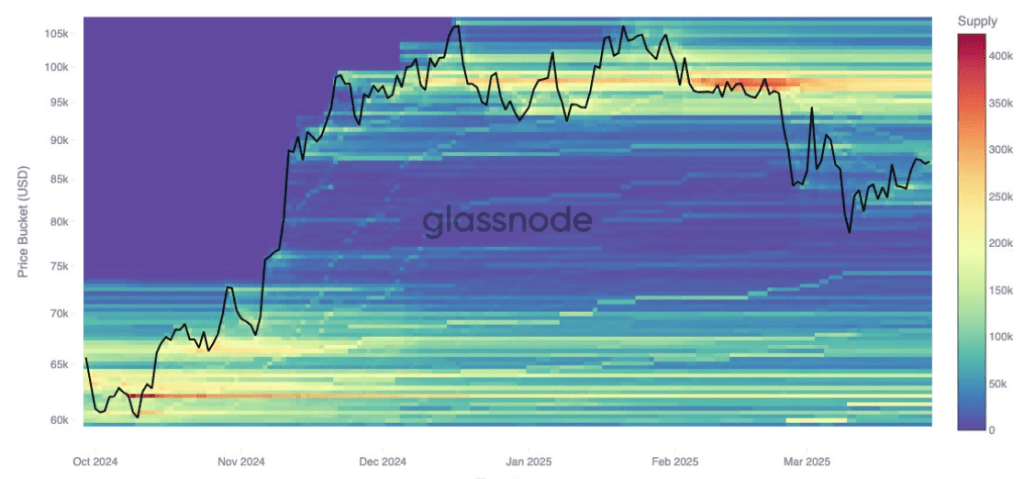
Bitcoin Support Thins Below $78,000 As Cost Basis Clusters Shift Toward $95,000
Bitcoin’s price action in the past 48 hours has seen it approaching the $80,000 price level again, w...
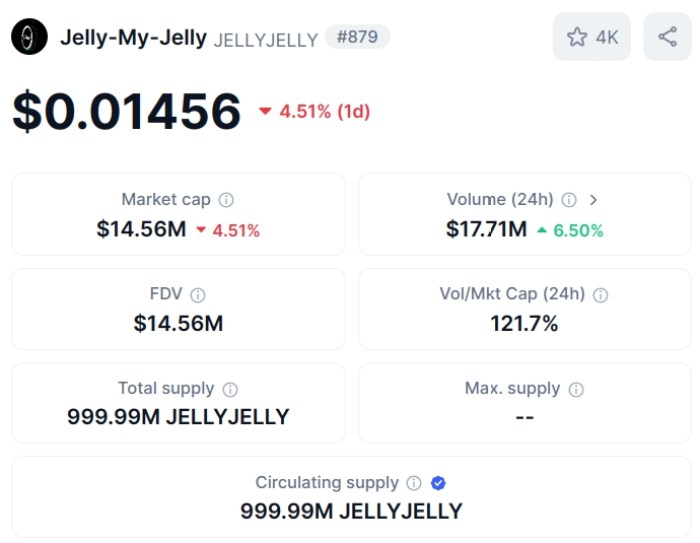
Hyperliquid Delists $JELLY, Potentially Causing $900K in Losses. Here’s Why Best Wallet Token Can 100x
The crypto community was just recovering from the aftermath of the Bybit hack, which saw North Korea...