PENGU Price Prediction for April 2: Can It Rebound After Falling Below $0.005?


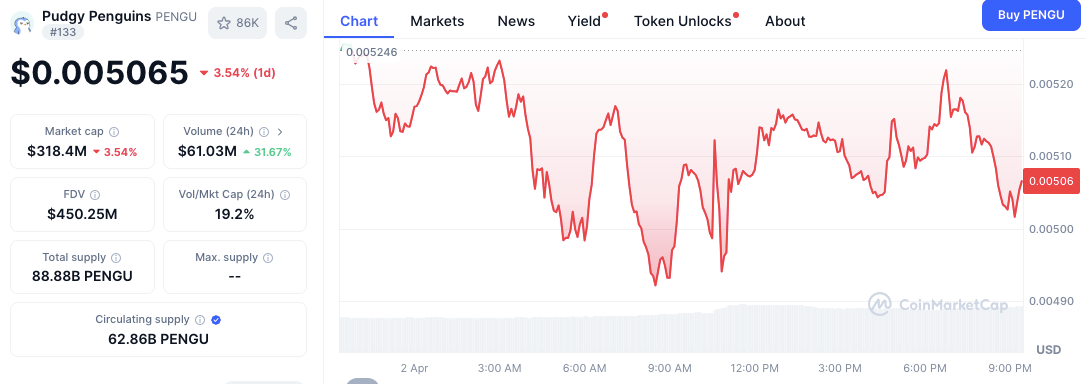
- PENGU drops 3.54% despite 31.67% spike in trading volume to $61.03 million.
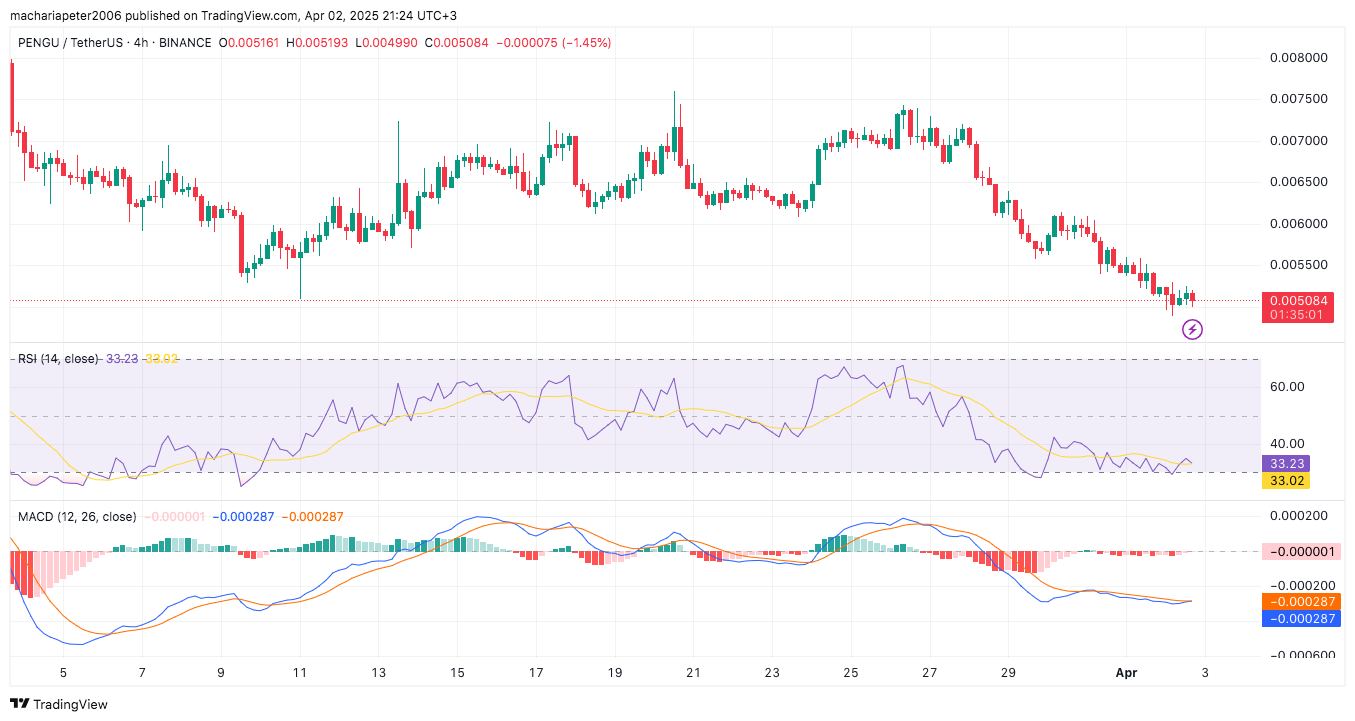
- Technical indicators show bearish momentum; RSI at 33.23, MACD remains flat.
- Token trades well below launch high of $0.05738, now at $0.005065 with high volatility.
Pudgy Penguins’ native token,
PENGU
, continues to face selling pressure, falling 3.54% over the past 24 hours despite a sharp surge in trading volume. The token is now priced at $0.005065, down from earlier intraday highs of $0.005246. PENGU briefly dipped below the $0.005 mark before recovering during the session, highlighting increased volatility across lower timeframes.
According to CoinMarketCap data, PENGU’s 24-hour trading volume rose to $61.03 million, a 31.67% increase. The trading surge coincides with a declining price trend, suggesting intensified trading activity or short-term repositioning by investors.

PENGU’s market capitalization currently stands at $318.4 million, with a fully diluted valuation (FDV) of $450.25 million. Circulating supply figures have reached 62.86 billion PENGU, while the total supply is capped at 88.88 billion. The volume-to-market cap ratio is at 19.2%, indicating high liquidity levels relative to market capitalization.
Currently, PENGU is trading below the price it was at the first day of its launch, for which it had a strong trading volume. The token was launched on December 17, 2024, and it went through high volatility and reached a peak of $0.05738 at the end of the day. But the price dropped in the subsequent days and recorded a low of $ 0.02302 on December 20.
Technical Indicators Reflect Bearish Continuation
Short-term indicators suggest that PENGU remains under bearish pressure. On the 4-hour chart, the Relative Strength Index (RSI) is recorded at 33.23, hovering just above the oversold level of 30. The RSI line is currently below its signal line, which is at 33.02, signaling weakened buying interest.
The Moving Average Convergence Divergence (MACD) indicator also aligns with the ongoing downward momentum. The MACD line and the signal line are both positioned at -0.000287, with the histogram showing minimal activity around the zero mark.

The price trend has been negative since late March, forming a pattern of lower highs and lower lows. The short-term outlook remains cautious with RSI near oversold territory and no bullish signals from MACD.
This token might undergo further retracement if the RSI goes below 30 and the MACD fails to present a bullish divergence. Conversely, if RSI begins to trend higher or if MACD produces a bullish crossover then the tide is turned in the favor of buyers.

Ethereum Grapples with $1,810 Price Slump Amid Fee Collapse and Rising Inflation
Ethereum is the second-largest cryptocurrency by market cap but its value has plummeted down to $1,8...

Next Big Crypto Heatmap: Qubetics Crushes Presale with 699 Tokens per $1 as SEI and Arweave Hold the Line
Qubetics dominates next big crypto buzz with 699 tokens per $1, while SEI eyes $0.19 and Arweave hol...

Bitcoin Falls Below $83,300 as Crypto Market Faces Volatility
Bitcoin ($BTC) dropped 0.86% to $83,284 as the crypto market declined, and Ethereum ($ETH) showed a ...

