Cardano Price Prediction for April 4: Can ADA Hold Above $0.620 After Sharp 6% Drop?


- Cardano drops nearly 6% amid market volatility and surging trading volume.
- Derivatives data shows mixed sentiment, long liquidations dominate recent trades.
- Persistent exchange outflows and bearish technicals signal weak short-term momentum.
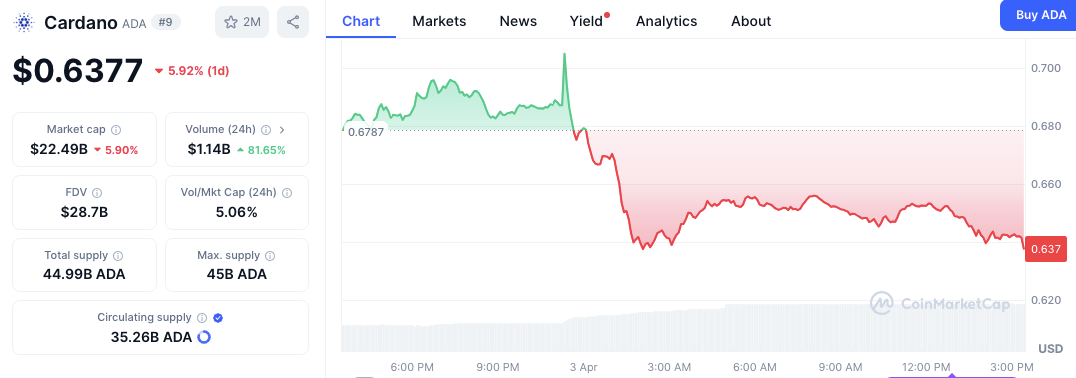
Cardano (ADA) saw renewed selling pressure on April 3, declining nearly 6% to $0.6377 within 24 hours. The drop follows a short-lived rally late on April 2, when the token reached $0.6787 before reversing. As volatility strengthened, traders reacted quickly to shifting market dynamics, with derivatives and spot market data indicating growing caution and uncertainty around the asset.
A spike in trading activity accompanied the decline in ADA’s price. Over the past 24 hours, trading volume surged 81.65% to $1.14 billion, suggesting profit-taking or a reaction to broader market sentiment. Meanwhile, Cardano’s market capitalization dropped by 5.90%, settling at $22.49 billion.

ADA’s circulating supply currently stands at 35.26 billion out of a maximum 45 billion, giving it a fully diluted valuation of $28.7 billion. The volume-to-market cap ratio of 5.06% shows active market participation during the downturn, raising the likelihood that traders responded strongly to short-term price changes.
Derivatives Market Reflects Cautious Sentiment
Derivatives trading in Cardano showed mixed signals. Total volume in the derivatives market rose 42.63% to $2.20 billion, but open interest declined by 5.66% to $695.56 million. Options activity experienced a decline, with volume collapsing 92.94% to $6.59K and open interest dipping slightly to $374.92K.
The 24-hour long/short ratio remained near neutral at 0.9459, though platform-specific data indicated stronger long positions. On Binance, the ratio stood at 2.6576, while OKX posted a higher 3.69. Binance’s top traders also maintained a long bias, with a ratio of 1.1411.

Liquidation data revealed $4.42 million in total losses, with long positions accounting for $3.15 million and short liquidations at $1.28 million. Over the past 12 hours, long liquidations reached $586.28K, higher than $44.13K in shorts, indicating heightened volatility over shorter timeframes.
On-Chain Flows and Technical Indicators Reinforce Bearish Outlook
Coinglass Based on the netflows data analysis, ADA continues to have outflows starting in November of 2023. The average daily reading depicts that the outflow is more than $30 million, while the inflow event was recorded to be more than $100 million in February 2024. Nonetheless, the price of ADA has been oscillating at around $0.60 recently, indicating that short-time sellers have little to stop them and that there is no major enthusiastic buying.

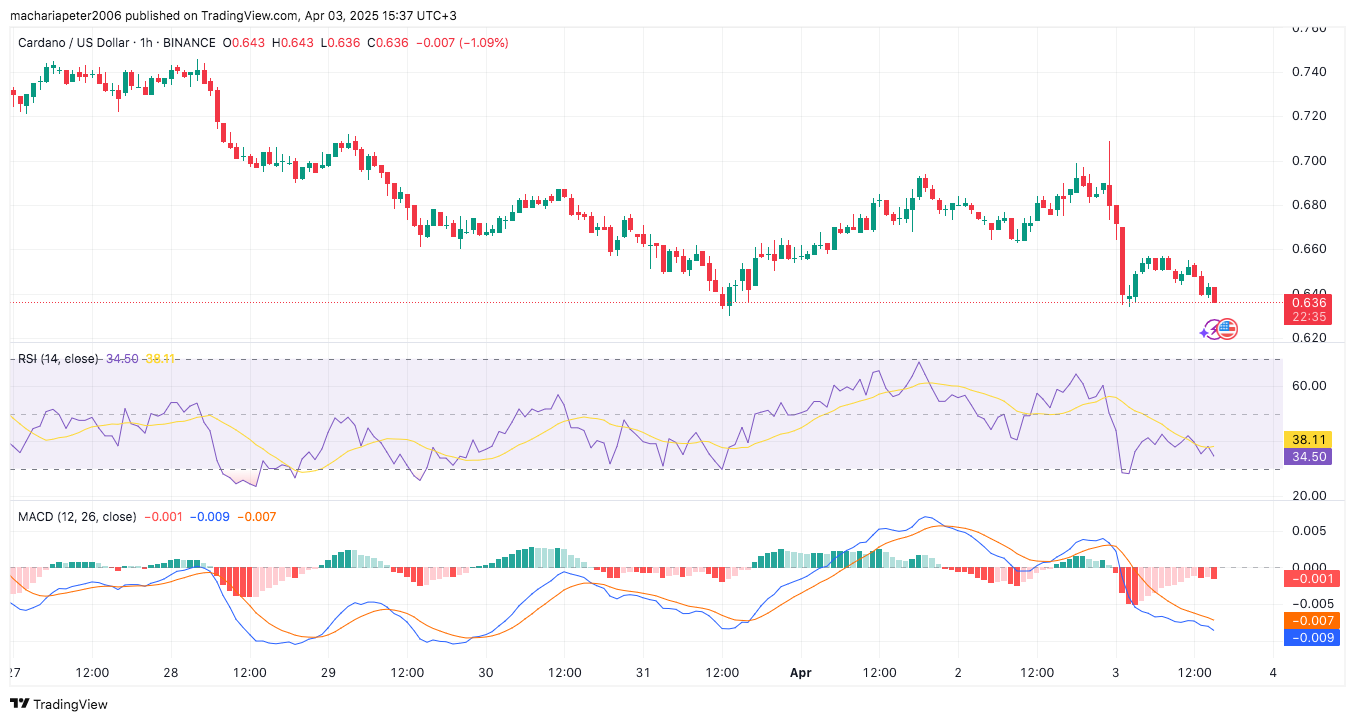
Technical indicators also reflect a bearish trend. The Moving Average Convergence Divergence (MACD) shows a negative crossover, with the MACD line at -0.009 and the signal line at -0.007. The RSI dropped to 34.50, approaching oversold levels.

Source: TradingView
Currently, the ADA price is declining, and the main support level is $0.620. It could lead to further losses if the support is broken and only an improvement in RSI and MACD would indicate that the tide has turned.

Cardano, Dogecoin, and Shiba Inu Investors All Have One Thing In Common; They Are Buying Up This New Record-Breaking Altcoin
Cardano, Dogecoin, and Shiba Inu whales are shifting millions into Rollblock (RBLK), a new GameFi al...

Crypto Meets Fiat: Nomy and MahrebGroup Merger Accelerates Strategic Expansion in Digital and Traditional Finance
Nomy and MahrebGroup merge to unite crypto and fiat finance, expanding global access to compliant di...

Bitcoin ETFs See $159M Inflow Surge While Ethereum ETFs Face $19M Outflow Dip
The Bitcoin ETFs and Ethereum ETFs saw opposing movements on April 3 as BTC ETFs received a sizeable...

