Ethereum Mega-Whales Exit as Network Activity and Price Decline


- Ethereum mega-whale wallets drop 10.3% as price falls nearly $800 in six weeks.
- Q1 2025 marks ETH’s worst quarterly loss since 2018, with Q2 recovery still absent.
- On-chain data shows weak user activity and bearish momentum amid declining ETH demand.
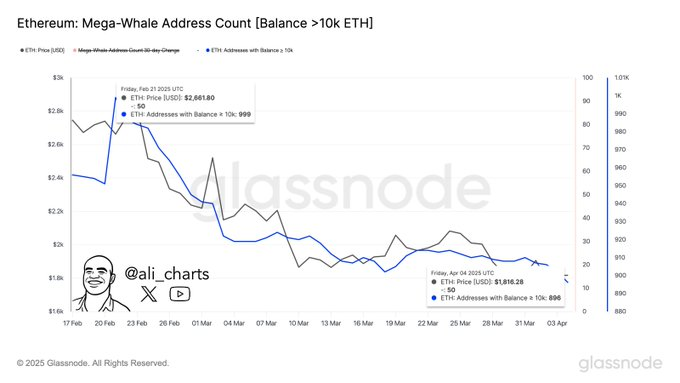
A reduction in Ethereum mega-whale addresses has emerged alongside a major price decline, indicating shifts in market behavior during the first quarter. On-chain data shows a 10.3% drop in wallets holding over 10,000 ETH, which coincided with Ethereum’s slide from $2,618 to $1,818 between February 23 and April 3, 2025.
This contraction in large-holder activity follows Ethereum’ s worst Q1 performance since 2018 and raises questions about investor confidence amid weakened market conditions. According to data from Glassnode, the number of Ethereum wallets holding over 10,000 ETH fell from 999 to 896 between late February and early April.
This decline in high-value wallets marks a contraction in large-holder participation during the same period in which Ethereum’s price fell by nearly $800.
A chart shared by analyst @ali_charts visually links the decline in mega-whales to Ethereum’s falling value . Large wallet exits have historically been associated with changes in institutional sentiment or profit-taking during periods of uncertainty.

Q1 Losses Mark Historical Lows, Flat Q2 Start
Ethereum ended the first quarter of 2025 with a decline of -45.41%, its most severe Q1 drop since the -46.61% recorded in 2018, as per Coinglass data cited by Mister Crypto. The losses reflect a period marked by macroeconomic pressure, reduced trading volumes, and falling on-chain metrics.
Although there was some form of recovery in Q2 of 2018, with Ethereum reaching 15.29%, the same was not witnessed in Q2 of 2025. This still remains very close to bearish territory with Ethereum working on a negative Q2 return of -0.88%.
This year’s performance contrasts Ethereum’s historical Q2 average of +60.07%. However, current market behavior diverges from previous patterns, showing no signs of momentum.
User Activity and Price Struggle to Rebound
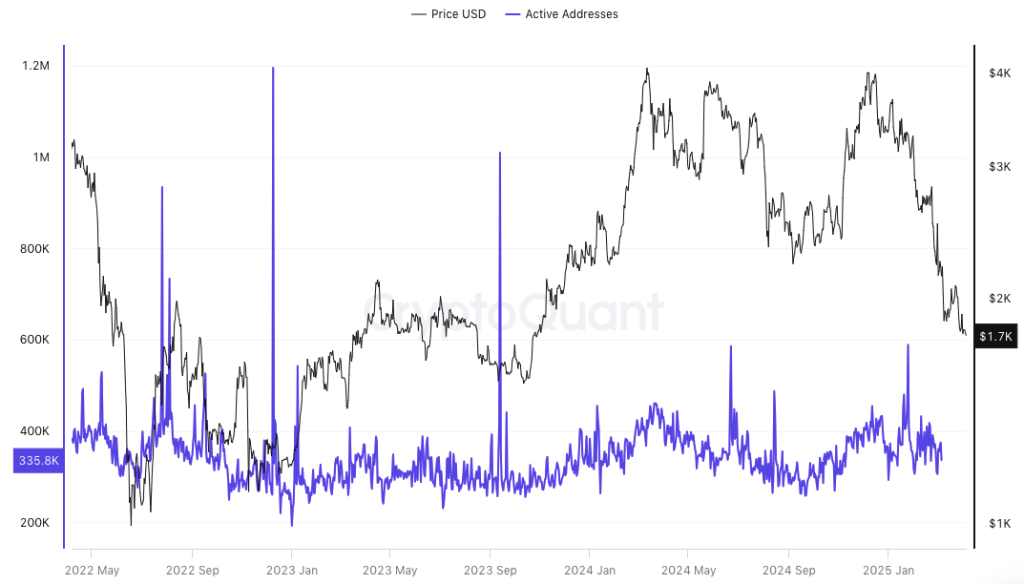
Data from CryptoQuant shows a stagnation in Ethereum network activity, with daily active addresses at around 335,800.
The platform also indicates that the price of Ethereum trading at $1,700 has declined, it was up from the highs around $4,000. This means there is decreased value on-chain activity and number of transactions, which is correlated with weak demand from both individual and institutional customers.

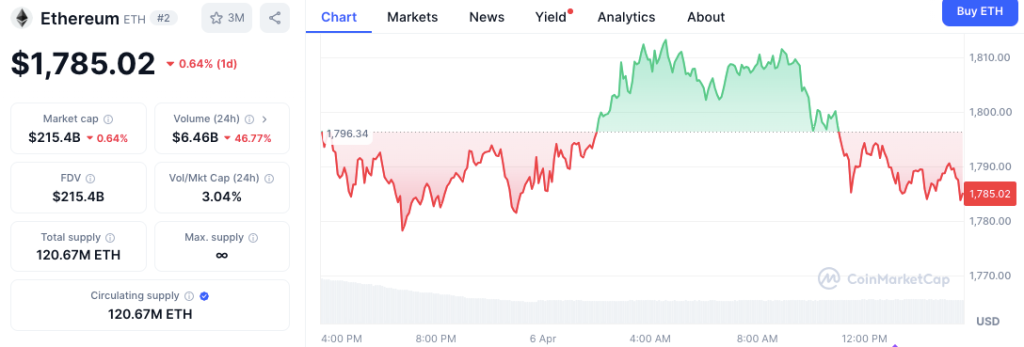
Additionally, CoinMarketCap data shows ETH trading at $1,785.02 with mild daily volatility. Market capitalization is down 0.64%, now at $215.4 billion, while the 24-hour trading volume has dropped 46.77% to $6.46 billion.

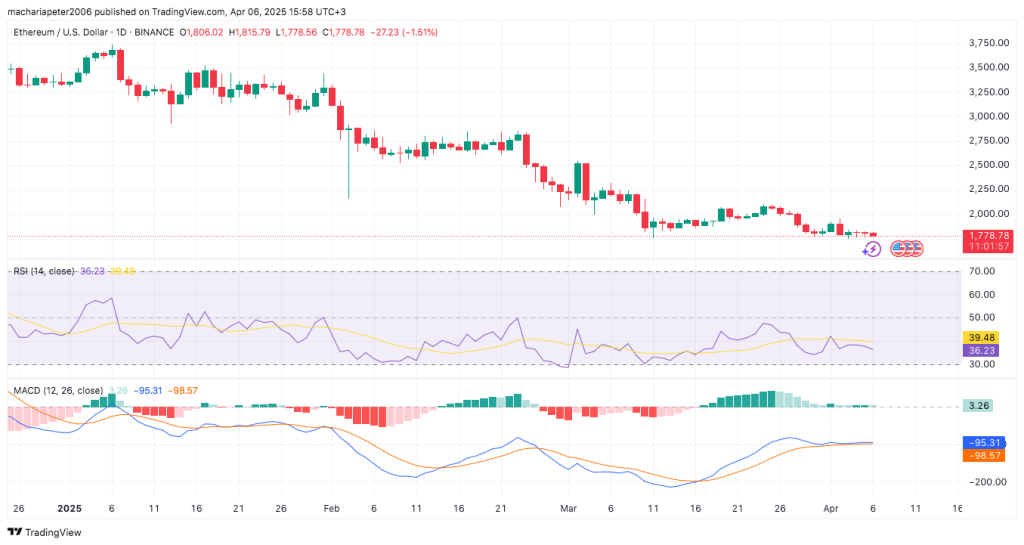
The technical analysis of Ethereum still suggests that the sentiment in the market is bearish. RSI is at 36.23, thus being below the mean estimate of fifty, implying that selling pressure is still dominant. The MACD line is slightly above the signal line but the histogram does not show such strength to confirm a reversal.


Whale Doubles Down on Solana with $3.72M Purchase, Signals Strong Bullish Sentiment
Big news as SOL tokens worth $3.72 million at $116.25 each were purchased by a Solana whale on April...

Official Trump Coin Price Prediction: Will TRUMP Price Gain President’s Support?
Official Trump meme coin struggles despite President’s support. Our Official Trump coin price predic...

StabilityWorldAI Integrates KaratDAO to Power Decentralized Identity in Web3
Stability WorldAI integrates with KaratDAO to ensure a secure, decentralized identity and AI-driven ...

