Blockchain surveillance platform Glassnode has revealed events that occurred on-chain, leading to the crash of Mantra's OM token.
In a recent
commentary
, blockchain analytics platform Glassnode presented important information around the dramatic collapse of Mantra's OM token, which nosedived 98% on April 13, 2025, in under an hour.
While
the crash
has already triggered massive losses for investors, Glassnode's latest report highlights what happened behind the scenes using behavioral metrics such as exchange flows, holder concentration, realized capitalization, and user activity.
Price Collapse and Exchange Behavior
According to Glassnode's data, OM's price dropped sharply below the $1 mark within a few hours, leading to panic across the market.
Interestingly, the platform found no major token inflows to centralized exchanges before the collapse, suggesting that the initial crash was not preceded by whales or insiders trying to offload positions en masse.
https://twitter.com/glassnode/status/1911729784947683675
Instead, the most significant exchange inflow spike came after the price had already tumbled. Specifically, approximately 38 million OM tokens were moved to exchanges around 08:20 UTC on April 14, with the price sitting at $0.71.
This pattern strongly indicates a reactionary wave of panic selling, likely from retail investors or opportunistic traders seeking to offload or trade during the volatility.
On the other hand, exchange outflows surged shortly after OM hit its bottom. Glassnode interprets this behavior as potentially resulting from users withdrawing tokens post-liquidation, taking advantage of cheap buys, or exchanges minimizing exposure due to liquidity risk.
OM Exchange Outflows
Shifting Holder Concentration and Realized Cap Movements
Before the crash, the percentage of OM supply held by the top 1% dropped modestly, from around 96.4% to 95.6%. Glassnode stressed that while this dip isn't record-breaking, it is significant, given the token's extremely concentrated supply structure.
https://twitter.com/glassnode/status/1911729790467309711
Importantly, this metric excludes known team, contract, and centralized exchange wallets, implying that either large non-team holders redistributed their tokens or that liquidation events forcibly dispersed holdings.
This slight reduction in concentration might reflect growing unease among big players or signals of internal rebalancing, but it wasn't enough to trigger early red flags, making the crash more difficult to anticipate.
Further, OM's realized capitalization, a measure of the aggregate cost basis of all holders,
plummeted
by $740 million (20%) between April 13, 18:30 UTC and April 14, 03:10 UTC. This kind of value loss, especially within a short window, shows signs of large-scale liquidations or forced selling.
OM Realized Cap
Notably, the sharp reset of the cost basis suggests that holders were exiting at losses en masse, confirming that the event was more than just a typical correction.
Network Activity Spikes and LTH Movements
Meanwhile, Glassnode
confirmed
that a massive increase in on-chain activity accompanied the price collapse. Transfers of OM tokens skyrocketed, hitting a peak of 1,400 transactions within 10 minutes. Before this, activity had remained relatively flat, and it tapered off shortly after the peak.
OM Number of Transfers
Similarly, the number of active addresses surged during the crash, topping out at 574. This indicates that the panic was not limited to a handful of addresses but rather a broad set of participants across the network. Such a widespread reaction points to the idea of a systemic shock rather than a coordinated dump by a few wallets.
https://twitter.com/glassnode/status/1911729798809796612
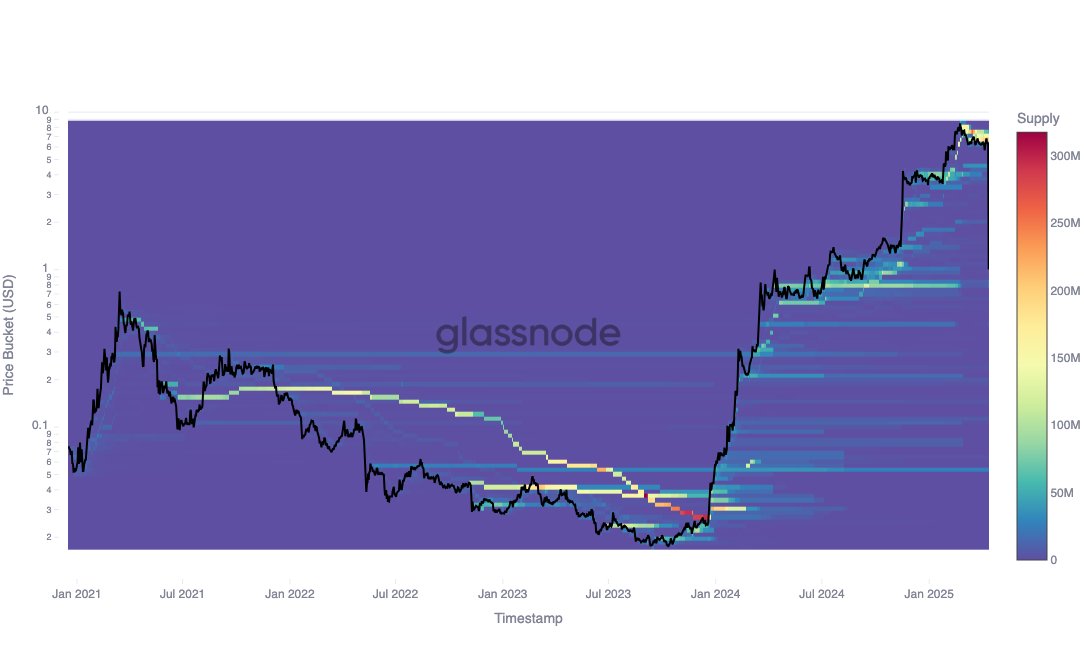
Also, Glassnode's Cost Basis Distribution analysis revealed that early holders who accumulated tokens in 2022 at prices as low as $0.05 likely did not trigger the crash.
The largest concentration of OM holdings remains from more recent acquisition zones, particularly around the $6.66 mark. This suggests that long-term holders may have sat out the chaos while newer investors took the hardest hits.
OM Cost Basis Distribution
Broader Context
Prior to the crash, some analysts had raised red flags over OM's tokenomics, especially its extreme supply concentration.
Allegations surfaced that a group known as the "Kabal team" may have dumped tokens, though those claims remain unverified. Additionally, OM's earlier vertical rally had already raised suspicions about sustainability. For instance, OM initially spiked 4,260% from $0.0240 to $1.0465 in April 2024.
Essentially, Glassnode's breakdown suggests this was not the work of a single actor but a network-wide drop of confidence and liquidity. Meanwhile, OM has recovered slightly but still remains 88% down in the past 24 hours, currently trading for $0.6890.
Disclaimer: This article is copyrighted by the original author and does not represent MyToken’s views and positions. If you have any questions regarding content or copyright, please contact us.(www.mytokencap.com)contact