Bitcoin Reclaims Key Support and Breaks Trendline as Traders Eye $88K Resistance Zone


- Bitcoin breaks multi-month downtrend, retests $84K as new support level.
- $88K eyed for bullish structure break; 4h 200EMA flipped to support.
- Monthly chart holds macro uptrend; $68K–$70K remains critical support.
Bitcoin has broken above a multi-month descending trendline, renewing interest among traders and analysts watching for confirmation of a complete trend reversal. The breakout, observed after multiple failed attempts since February, has shifted the focus to the $84,000 level, which is now being tested as support.
Recent chart analysis highlights that Bitcoin successfully breached a long-standing downward trendline that had previously acted as resistance across several timeframes. This trendline, active since early February, was tested and rejected multiple times before this week’s breakout to the upside. Analysts noted that the breakout occurred with the price reclaiming the $82,000 support zone, a key level tested several times throughout the year.
According to trader Jelle, the price has also flipped the 4-hour 200 exponential moving average (EMA) into support, strengthening the outlook for a sustained move higher. He suggested a major move to $88,000 could signal a bullish market structure break and shift the EMA slope upward, confirming a trend reversal.
The chart includes annotations indicating a “bullish bias,” particularly at the trendline retest area, which often acts as a confirmation level for market direction changes. If the price continues to hold above this former resistance and turns it into support, analysts expect further upside toward the next resistance zone.
Monthly Chart Holds Macro-Level Support
Bitcoin maintains its macro uptrend on the monthly chart despite retracements from recent all-time highs. The asset consolidates above a key support band between $68,000 and $70,000. This zone was previously resistant in 2021 and now acts as long-term support after being retested in early 2025.
Price action from 2017 through 2025 reveals a consistent pattern of periodic volatility, but the overall trend shows higher lows and sustained bullish structure. Monthly candles indicate consolidation after a strong rally in 2023 and early 2024.
While there have been short-term pullbacks, the broader trend remains intact. Analysts note that any breakdown below the $68,000 support would risk a deeper retracement, but the uptrend remains valid.
Intraday Action Shows Volatility Around $84K
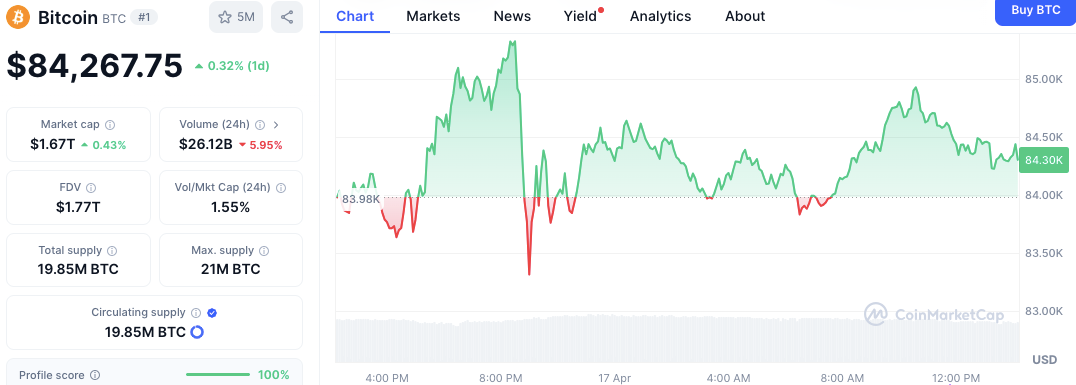
According to CoinMarketCap, Bitcoin is currently priced at $84,267.75, reflecting a 0.32% gain in the past 24 hours. Intraday movement on April 17 was volatile, with the asset trading between $83,980 and $85,000. A breakout above $85,000 was met with a sell-off around 8 p.m. UTC, though the price gradually recovered into the morning hours.

Market turnover has lowered to $26.12 billion, shrinking by 5.95% daily. However, based on the market capitalization, which has now reached $1.67 trillion, a sign of growth has been observed with much less trading volume. The volume to market capitalization ratio at 1.55% shows a moderate exchange of shares in the market daily. Currently, the circulation of bitcoin is approximately 19.85 million, which is quite close to the maximum limit of 21 million.

Coinbase Slams Oregon Attorney General Over ‘Copycat’ Lawsuit
As per Paul Grewal, the lawsuit filed by Oregon Attorney General again revives the claim that was di...

Crypto Market Patterns Mirror 2024 Correction: A Massive Turnaround Ahead?
According to CryptoQuant, a new pattern has emerged in the crypto market that displays similar featu...

Top NFT Coins Based on Social Activity Today
The top NFT coins in social activity include $RENDER, $ICP, and $FET. Additionally, the top ten play...

