Ethereum Price Holding Strong — Signs Point to a New Upside Breakout


Ethereum price corrected gains and tested the $2,500 zone. ETH is now again rising and might soon aim for a move above the $2,600 zone.
- Ethereum started a correction from the $2,740 zone and tested $2,500.
- The price is trading above $2,520 and the 100-hourly Simple Moving Average.
- There is a key declining channel or a possible bullish flag forming with resistance at $2,575 on the hourly chart of ETH/USD (data feed via Kraken).
- The pair could gain strength if it clears the $2,600 resistance in the near term.
Ethereum Price Eyes Upside Break
Ethereum price struggled to clear the $2,740 resistance and started a downside correction, like Bitcoin . ETH traded below the $2,700 and $2,650 support levels.
The bears were able to push the price below the 50% Fib retracement level of the upward move from the $2,415 swing low to the $2,735 high. The price even spiked below the $2,520 level, but the bulls were active near the $2,500 zone.
The price found support near the 76.4% Fib retracement level of the upward move from the $2,415 swing low to the $2,735 high. Ether is again rising from the $2,500 zone.
Ethereum price is now trading above $2,520 and the 100-hourly Simple Moving Average . On the upside, the price seems to be facing hurdles near the $2,575 level. There is also a key declining channel or a possible bullish flag forming with resistance at $2,575 on the hourly chart of ETH/USD.
The next key resistance is near the $2,600 level. The first major resistance is near the $2,650 level. A clear move above the $2,650 resistance might send the price toward the $2,735 resistance. An upside break above the $2,735 resistance might call for more gains in the coming sessions. In the stated case, Ether could rise toward the $2,800 resistance zone or even $2,920 in the near term.
Another Decline In ETH?
If Ethereum fails to clear the $2,600 resistance, it could start a fresh decline. Initial support on the downside is near the $2,525 level. The first major support sits near the $2,500 zone.
A clear move below the $2,500 support might push the price toward the $2,420 support. Any more losses might send the price toward the $2,350 support level in the near term. The next key support sits at $2,320.
Technical Indicators
Hourly MACD – The MACD for ETH/USD is gaining momentum in the bullish zone.
Hourly RSI – The RSI for ETH/USD is now above the 50 zone.
Major Support Level – $2,500
Major Resistance Level – $2,600

Ethereum Breaks Above Key Realized Price Zones—What It Means for ETH
Ethereum (ETH) experienced a slight price pullback over the past 24 hours, declining by 2.1% to hove...
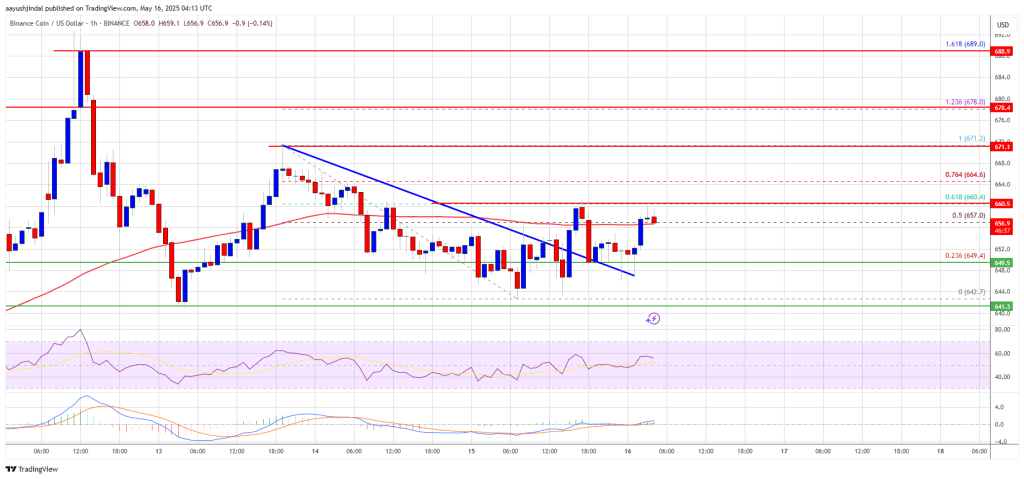
BNB Price Finds Its Footing — Can Bulls Ignite the Next Leg Up?
BNB price is consolidating above the $640 support zone. The price is now showing positive signs and ...

This Late-Stage Bitcoin Bull Run Signal Hasn’t Shown Up Yet
On-chain data shows the Bitcoin Binary CDD is yet to reach the same peak as during the last few tops...