Dogecoin On The Edge: Major Breakout Or Breakdown Imminent?


The Dogecoin price could be at a critical juncture for a breakout but momentum needs to persist.
On the four-hour chart shared by analyst Josh Olszewicz, price has been sliding inside a clearly defined falling-wedge formation since printing a local high at $0.25941 on 13 May. The upper and lower boundaries of that wedge continue to drift lower, trapping successive swing highs and lows; the lower rail is presently guiding support at while the upper rail caps the market near $0.219.
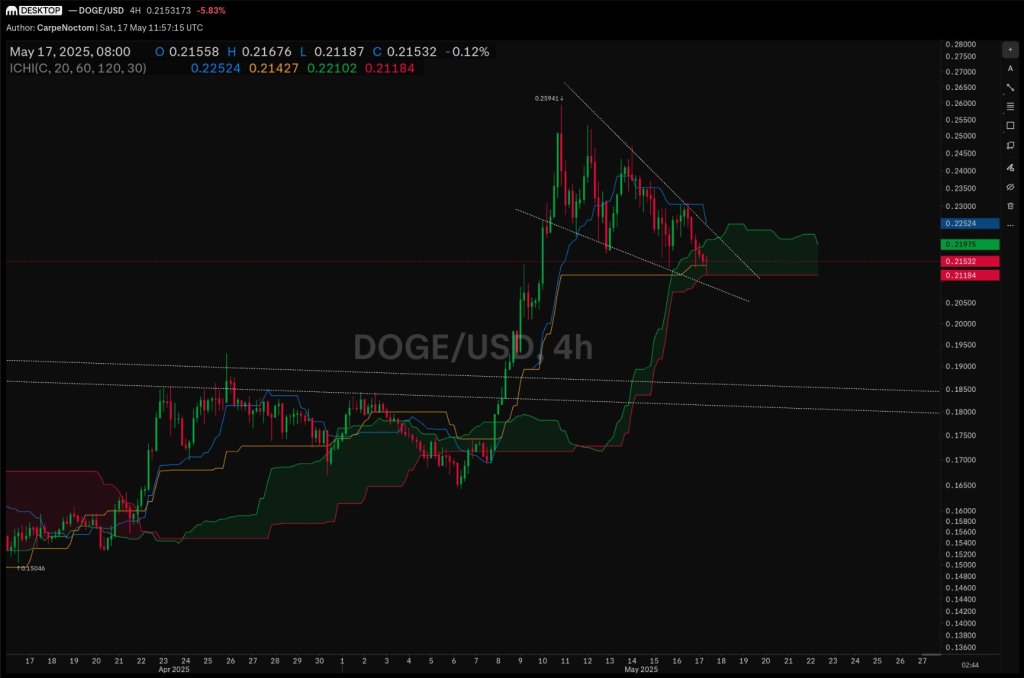
Within that compression, Olszewicz overlays an Ichimoku system set to short-cycle parameters (20/60/120/30). The most recent completed candle — stamped 17 May 08:00 UTC — settled at $0.21532 after trading between $0.21187 and $0.21676. That close left price lodged squarely inside the cloud, a location that typically denotes equilibrium. Internally, the Tenkan-sen rests at $0.21427, the Kijun-sen at $0.22524, Senkou Span A at $0.22102 and Senkou Span B at $0.21184, creating an unusually tight band of short-term reference levels.
The zone between the wedge floor and Span B around $0.212–0.214 forms a high-confluence support zone that has already produced two intraday rebounds. Conversely, the Kijun-sen and descending wedge resistance intersect near $0.225, erecting an equally visible ceiling overhead. As long as price remains trapped between those two lines, momentum traders are likely to see a low-volatility coil; the first decisive breach — particularly a four-hour close through the upper rail — would satisfy every textbook criterion for a bullish falling-wedge resolution and mechanically projects a return toward the 13 May high.
Dogecoin Looks Still Strong
Cantonese Cat’s weekly perspective speaks to a larger cycle. In his chart, Dogecoin has just finished its first weekly close above the Bull Market Support Band — essentially the 20-week simple moving average enveloped by a two-sigma envelope — since early February. That band currently spans $0.21617 at the lower edge to $0.22378 at the upper edge; last week’s candle settled at $0.22387, a whisker above the cap, converting what had been resistance throughout the spring into provisional support.
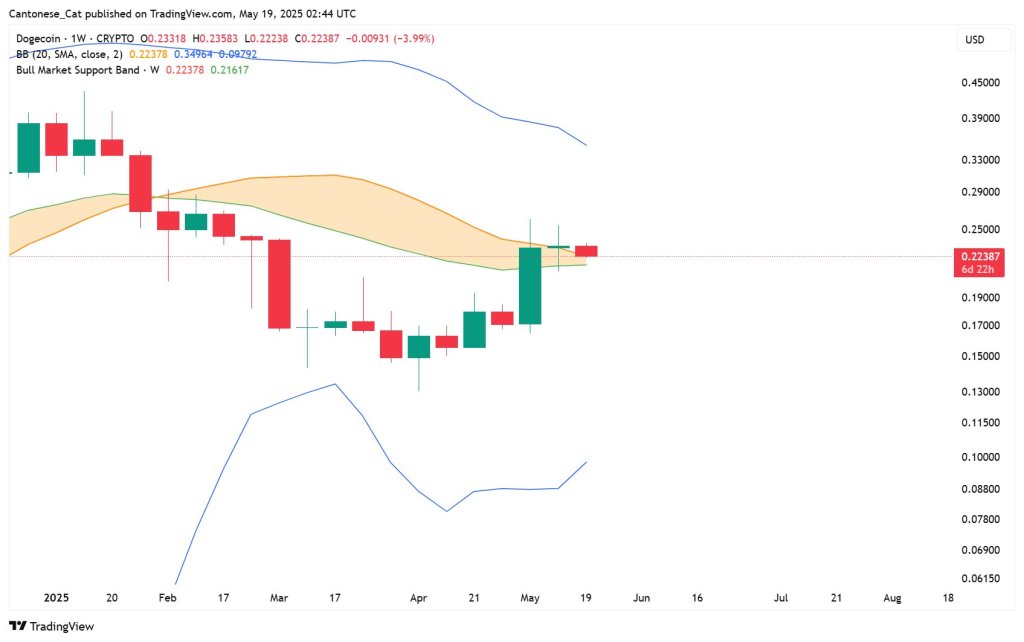
The break occurs while the Bollinger upper band is still descending from the February crest near $0.35, an indication that volatility on the weekly time-frame has only just begun to contract after a multi-month bear unwind. The midline of the Bollinger structure, identical to the 20-week SMA and the top of the Bull Market Support Band , is therefore the single most important pivot for the week ahead.
A second consecutive weekly settlement above $0.22378 would confirm the first as more than a one-off spike and could embolden trend-followers to price in a medium-term push toward the mid-$0.30s where the upper band presently curves.
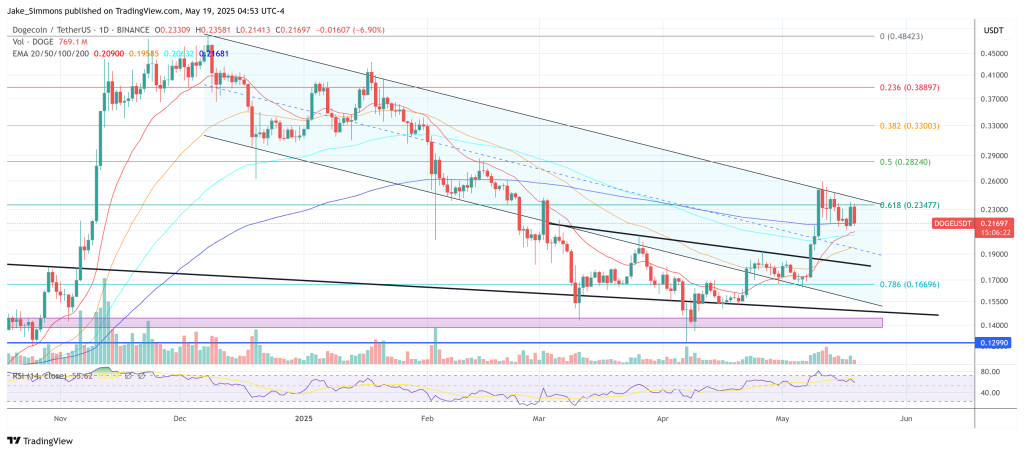
Taken together, the two time-frames sketch a clear roadmap. Short-term traders will be looking for a resolution of the descending wedge ; a bullish breakout through $0.219 would immediately shift focus to prior supply at $0.24-0.26, whereas a failure to hold $0.205 risks an acceleration toward the April pivot at $0.185.
At press time, DOGE traded at $0.217.
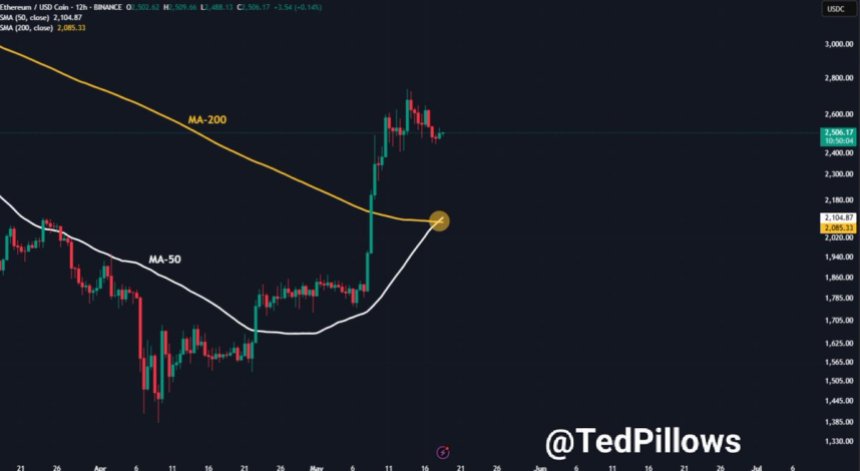
Ethereum Flashes Golden Cross Signal – Can Bulls Push ETH To $3,000?
Ethereum is now trading at a pivotal juncture after days of consistent selling pressure that have pu...
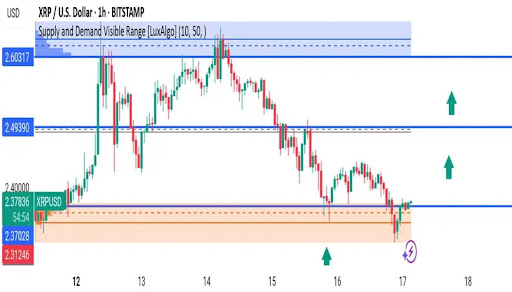
XRP Price Confirms Bullish Reversal Setup With This Demand Zone
A new technical analysis reveals that the XRP price has just confirmed a bullish reversal set-up on ...
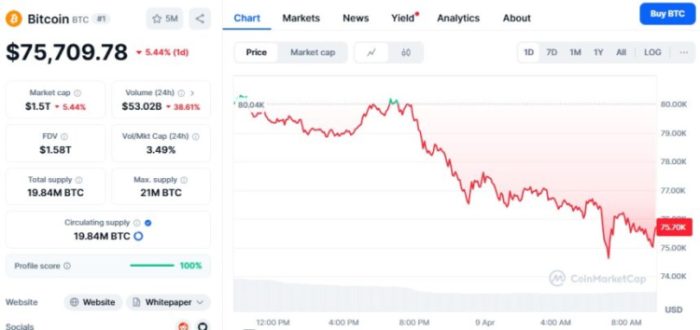
Bitcoin to Trigger the Largest Wealth Transfer in History – Get Free $BTC with BTC Bull Token
Mike Novogratz, the chief executive officer of Galaxy Digital, believes that Bitcoin can reach $22 t...