Bitcoin Analyst Highlights $175K Target as Price Consolidation Nears End


- Bitcoin may hit $175K by Sept 2025 if the 231-day cycle pattern holds.
- $66K reclaim and $109K close are key bullish breakout signals.
- ABC correction below $100K seen as a wick, not trend reversal.
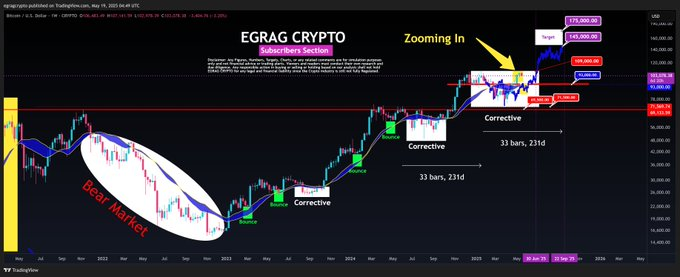
A recent technical analysis by chart analyst EGRAG suggests Bitcoin may be on course to reach $175,000 by September 2025. The forecast is based on a repeating pattern of corrective and impulsive cycles that have defined Bitcoin’s macro price action over the past several years. The analysis draws attention to a structured monthly candle chart, which reflects consistent historical behavior and highlights specific consolidation and breakout levels.
The model categorizes Bitcoin’s movement into alternating “Impulse” and “Corrective” phases. Each corrective period spans around 231 days, or 33 monthly bars, and has followed upward trends. These phases are part of a larger structural pattern in which temporary pullbacks lead to long-term upward continuation.
The analysis begins by mapping Bitcoin ’s decline during the 2022 bear market, followed by a transition into recovery phases throughout 2023 and 2024. EGRAG identifies three main corrective periods, each appearing between price rallies.

The current corrective structure is a rectangular zone ranging from $60,000 to $73,000. A tighter consolidation is visible within this band, indicating short-term indecision before a potential move higher.
The $66,000 level is marked as a critical retest area, where a successful reclaim could set the stage for bullish continuation. EGRAG’s chart tracks this level with a green marker and arrow, indicating that the next upward wave could push Bitcoin toward $125,000, $145,000, and possibly $175,000.
Technical Signals and Key Thresholds
The chart outlines several technical signals that support the bullish case. A breakout from the consolidation zone and multiple closes above the Bull Market Support Band are strong bullish signs. EGRAG emphasizes that Bitcoin must maintain a price above $93,000 on any timeframe. A sustained move below that level could weaken the bullish setup.
A closing price above $109,000 is considered the clearest sign of market strength. According to the analyst, this level marks the difference between a continued breakout and a failed rally. Any close below $109,000 would negate the bullish thesis and signal potential market weakness.
On the downside, the chart highlights support areas at $59,000, $53,000, and $49,000. These zones represent possible retracement levels in case of increased selling pressure.
ABC Correction Within a Bullish Framework
EGRAG also identifies an ABC correction pattern forming from a previous high near $106,000. This pattern implies a short-term pullback is underway but remains within the larger uptrend. The correction may briefly bring Bitcoin below the $100,000 mark. However, this move is expected to form a wick rather than a sustained breakdown.
The analysis concludes that the ongoing consolidation phase aligns with Bitcoin’s historical price behavior and that a breakout to new all-time highs remains on track. A projected blow-off top between $145,000 and $175,000 is considered part of the current cycle, provided structural support remains intact.

Solana Whale Nets $650K Profit From Meme Coins in Days
In line with the on-chain data, the Solana whale investor has expressed a great confidence in $BONK...

XRP Set for Possible $7.45 Breakout Amid Technical Indicators and DeFi Expansion
$XRP charts signal a possible surge to $7.45 as volume rises; XRPL activity and CTF Token burn may d...

SunPump to Boost TRON Meme Network in Collaboration with BingX
This latest collaboration aims to boost the adoption and visibility of prominent meme projects on th...


