Bitcoin (BTC) Price Drop To $105k Divides Crypto Traders: What Next?


The post Bitcoin (BTC) Price Drop To $105k Divides Crypto Traders: What Next? appeared first on Coinpedia Fintech News
The ongoing Middle East conflict has impacted the wider cryptocurrency market led by Bitcoin (BTC) price. In the past 24 hours, BTC price dropped over 3 percent to trade about $105k on Friday, June 13, 2025, during the mid-North American trading session.
The wider altcoin market experienced a similar drop, resulting in more than $1.1 billion rekt from crypto leveraged markets in the last 24 hours. As a result, crypto traders have been mixed with some remaining optimistic while some waiting for a clear signal to re-enter.
Bitwise CIO Matt Hougan Issues a Bold Bitcoin Prediction
The cryptocurrency market has been experiencing a stablecoins summer following the ongoing regulatory goodwill from major jurisdictions, led by the United States. As the global money supply (M2) grows exponentially, more institutional investors have proliferated into the stablecoins market, thus significantly improving the crypto liquidity.
Following the Bitcoin and wider altcoin drop in the past few days, Matt Hougan, the CIO at Bitwise, highlighted that an accumulation is more likely in the coming weeks before a parabolic rally before the end of this year.
“I think this is the ‘Summer of Accumulation’, a moment for long-term investors to build positions ahead of an epic EOY run,” Hougan noted .
What the Chart is Saying?
After enjoying an impressive rally following the end of the trade wars in the past two months, BTC price experienced a significant resistance level of about $112k. The flagship coin failed to rally beyond $112k and has since retraced to a crucial buy zone of around $105k.
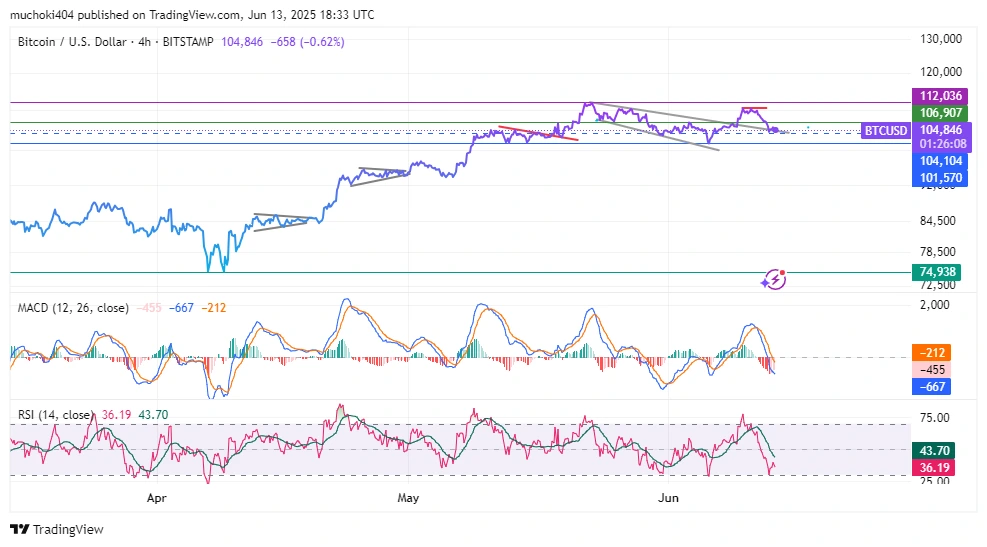
In the four-hour timeframe, Bitcoin’s Relative Strength Index (RSI) and MACD line KAS been hinting at potential reversal. Furthermore, the RSI has been hovering around the oversold levels and the MACD’s histogram has been hinting at declining selling pressure.

Crypto Market Faces $190M Liquidation—But Signs Hint at Upcoming Rally
The post Crypto Market Faces $190M Liquidation—But Signs Hint at Upcoming Rally appeared first on Co...
Michael Saylor Drops Explosive Bitcoin Prediction as Crypto Market Recovers
The post Michael Saylor Drops Explosive Bitcoin Prediction as Crypto Market Recovers appeared first ...

Uphold’s FXRP Staking Model Could Reshape XRP Rewards – If Regulators Allow It
The post Uphold’s FXRP Staking Model Could Reshape XRP Rewards – If Regulators Allow It appeared fir...