Dogecoin (DOGE) Struggles to Climb — Upside Moves Likely to Face Strong Resistance


Dogecoin started a fresh decline from the $0.1820 zone against the US Dollar. DOGE is now consolidating losses and might recover if it clears $0.1750.
- DOGE price started a fresh decline below the $0.1820 and $0.180 levels.
- The price is trading below the $0.1780 level and the 100-hourly simple moving average.
- There was a break above a bearish trend line forming with resistance at $0.1680 on the hourly chart of the DOGE/USD pair (data source from Kraken).
- The price could start a fresh decline if it stays below the $0.1780 zone.
Dogecoin Price Faces Resistance
Dogecoin price started a fresh decline after it failed to clear the $0.1820 zone, underperforming Bitcoin and Ethereum . DOGE declined below the $0.1800 and $0.1780 levels.
The bears even pushed the price below the $0.170 level. A low was formed at $0.1641 and the price is now attempting to recover. There was a minor move above the 23.6% Fib retracement level of the downward move from the $0.1811 swing high to the $0.1641 low.
Besides, there was a break above a bearish trend line forming with resistance at $0.1680 on the hourly chart of the DOGE/USD pair. Dogecoin price is now trading below the $0.1780 level and the 100-hourly simple moving average.
Immediate resistance on the upside is near the $0.1725 level. It is close to the 50% Fib retracement level of the downward move from the $0.1811 swing high to the $0.1641 low. The first major resistance for the bulls could be near the $0.1750 level.
The next major resistance is near the $0.1820 level. A close above the $0.1820 resistance might send the price toward the $0.1880 resistance. Any more gains might send the price toward the $0.200 level. The next major stop for the bulls might be $0.2120.
Another Decline In DOGE?
If DOGE’s price fails to climb above the $0.1750 level, it could start another decline. Initial support on the downside is near the $0.1680 level. The next major support is near the $0.1640 level.
The main support sits at $0.1620. If there is a downside break below the $0.1620 support, the price could decline further. In the stated case, the price might decline toward the $0.150 level or even $0.1440 in the near term.
Technical Indicators
Hourly MACD – The MACD for DOGE/USD is now losing momentum in the bearish zone.
Hourly RSI (Relative Strength Index) – The RSI for DOGE/USD is now above the 50 level.
Major Support Levels – $0.1640 and $0.1620.
Major Resistance Levels – $0.1750 and $0.1800.
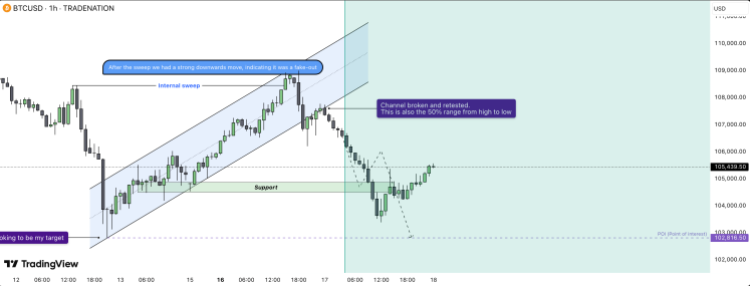
Bitcoin Channel Break Below $105,000 Sparks Panic, Analysts Predict Further Crashes
Bitcoin has been crashing with the advent of the new week, spurred on by uncertainties that surround...
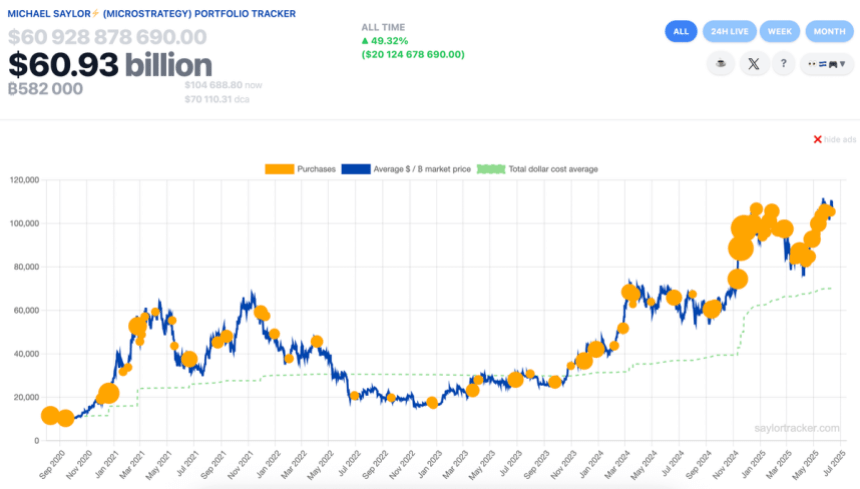
Analyst Warns: Strategy On Track For Historic Collapse, Bigger Than FTX
In a bold and alarming statement, on-chain analyst OxChain raised the possibility of a catastrophic ...
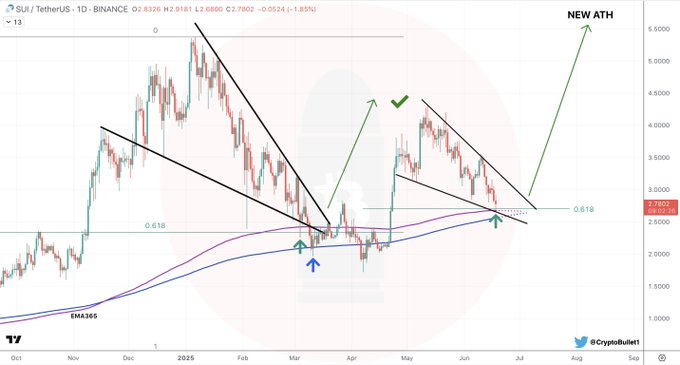
SUI Preparing For New Highs As Falling Wedge Breakout Targets $5
After falling below the key $3.00 mark, SUI now retests a make-or-break level that could ignite or s...