Ethereum Charts Signal Potential Bottom – All Eyes On Next Move


Ethereum is once again trading at critical demand levels, testing the lower boundary of a six-week range that began forming in early May. After briefly climbing toward $2,800 earlier this month, ETH has retraced back to the $2,400 zone, reigniting debate about whether this is a healthy consolidation or a sign of further downside to come. Despite the pressure, Ethereum has not broken below this range, signaling that buyers continue to step in at these levels.
This extended consolidation period suggests a decisive move is nearing. Breakouts from tight ranges like this one often lead to strong directional momentum, and ETH’s current price structure could act as a launchpad—if bulls regain control. According to top analyst M-log1, Ethereum may have already bottomed during its most recent retrace, with the current action reflecting accumulation rather than weakness.
The ETH/BTC ratio , another critical chart watched by traders, is also hovering near support levels, implying that a rotation back into altcoins may be imminent if Ethereum holds or pushes higher. For now, the market watches closely, as ETH’s next move could set the tone for broader altcoin performance in the weeks ahead.
Ethereum Holds Range As Market Awaits Decisive Break
Ethereum continues to trade within a tight consolidation range that began in early May, showing resilience despite growing global tensions and macroeconomic uncertainty. The price has hovered between $2,360 and $2,700, forming a narrow channel as buyers and sellers remain locked in a standoff. With conflicts in the Middle East intensifying and financial markets reacting to high interest rates and rising Treasury yields, crypto assets are under pressure, and Ethereum is no exception.
The long-anticipated altseason has yet to materialize, and Ethereum is widely seen as the key to unlocking that next phase. ETH’s dominance in the smart contract and DeFi space gives it a central role in leading altcoin market momentum. Traders and analysts are closely monitoring its current range, especially after M-log1 shared analysis suggesting the recent low at $2,360 could mark a local bottom.

According to M-log1, Ethereum is now consolidating just below the $2,450 level, and this zone could serve as a bullish trigger if reclaimed with strength. A decisive move in either direction will likely set the tone for the broader crypto market, with a breakout above $2,500 potentially igniting the next leg upward.
Until then, market participants are watching closely. If ETH fails to hold these demand levels, the range could break to the downside, delaying any altseason rally further. But if bulls regain control and push above key resistance, it could signal the start of a much-anticipated upward move. In this environment of uncertainty, Ethereum’s next breakout-or breakdown—could prove pivotal for market sentiment heading into the second half of the year.
ETH Tests Key Support As Price Retraces
Ethereum is currently trading at $2,405, down 4.17% in the last session, after testing a low of $2,367. The chart reveals that ETH has retraced back to the lower boundary of a six-week range, confirming strong demand in the $2,360–$2,400 area. This zone has acted as a critical support level multiple times, with bulls stepping in each time to defend it.
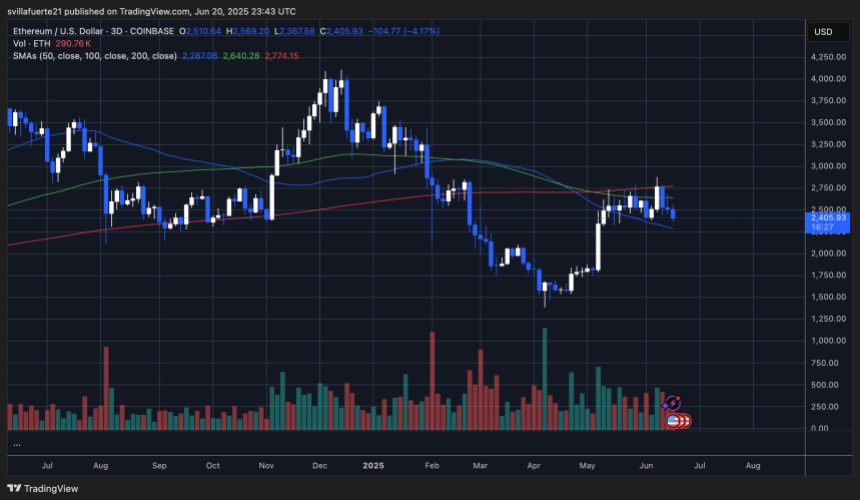
The price remains trapped below the 200-day moving average ($2,774), which has proven to be a strong resistance. Meanwhile, both the 50-day and 100-day moving averages are trending below price, currently sitting at $2,287 and $2,640, respectively, tightening the range even more. This compression typically leads to high volatility once a breakout occurs.
Volume has remained elevated during recent sessions, suggesting that buyers and sellers are actively competing for control. A decisive close below $2,360 could trigger a cascade toward $2,100 or lower. Conversely, if bulls manage to reclaim $2,500 and sustain momentum toward the $2,700–$2,800 resistance band, it may set the stage for a breakout.
Featured image from Dall-E, chart from TradingView
Bitcoin Price Breakdown Spurs Sell-Offs, Analyst Reveals What Will Happen If BTC Hits 92,800
The Bitcoin price crashed from as high as $106,000 to $102,000 on June 20, sparking sell-offs among ...
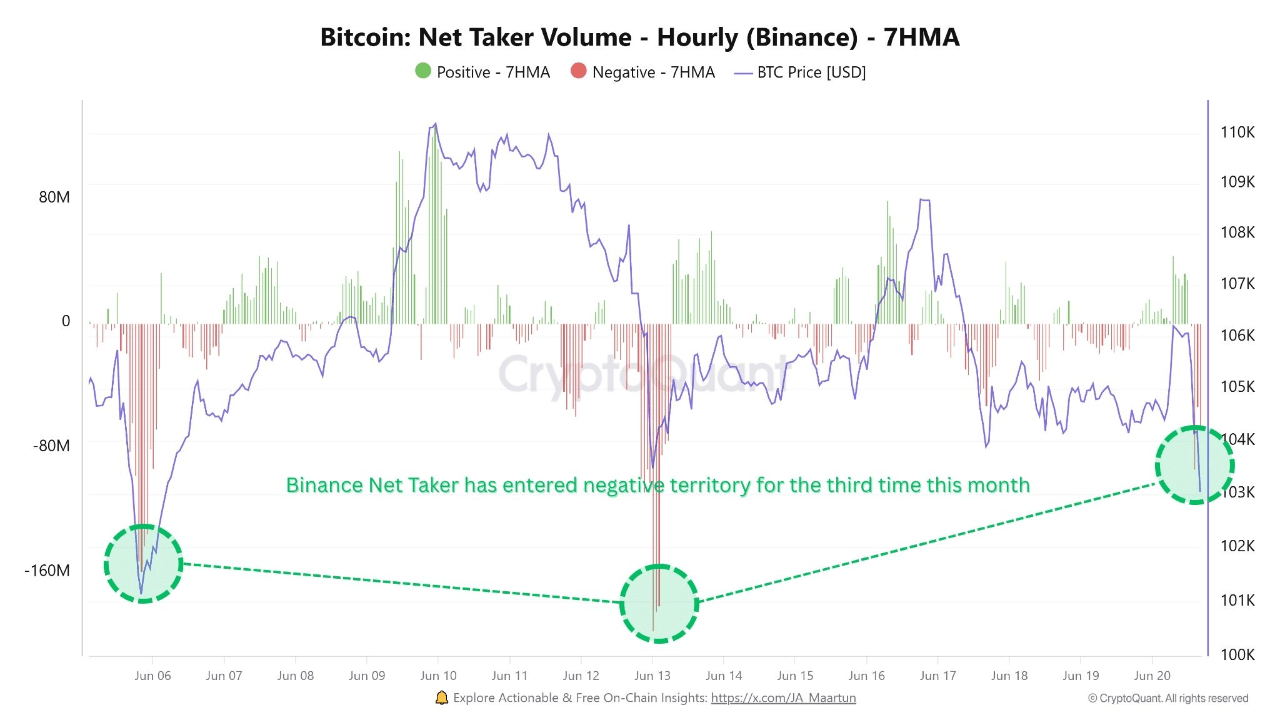
Bitcoin Net Taker Volume Enters Deep Red On Binance — What’s Next For BTC Price?
After another strong play for its all-time high in the past week, the price of Bitcoin has struggled...
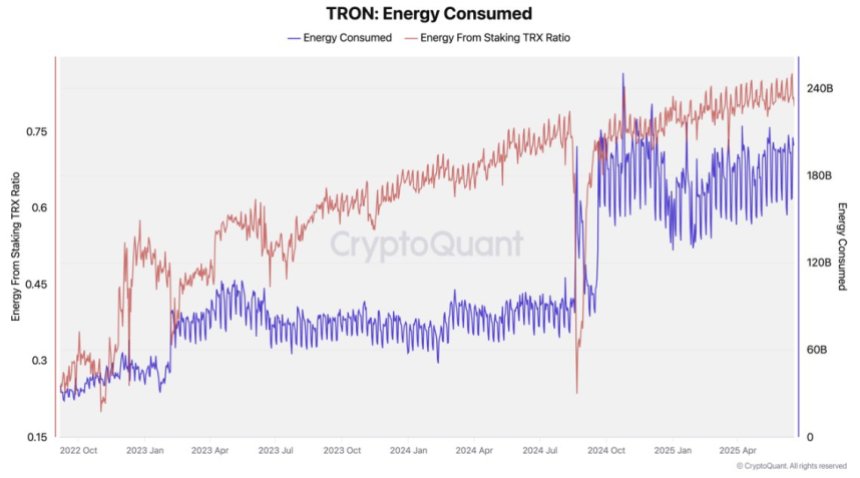
Tron Energy Usage Surges 108% – Smart Contract Activity Accelerates
Tron (TRX) has captured investor attention once again with major developments surrounding its future...