Bitcoin In For Another 460% Run? This Rare Fiat Signal Just Returned


The Global Money Supply has just hit a rare yearly growth rate of 9%. Here’s what followed for Bitcoin the last few times this signal appeared.
Global Money Supply Is Currently Sharply Going Up
In a new post on X, Capriole Investments founder Charles Edwards has talked about the latest trend in the Global Money Supply. The “ Global Money Supply ” refers to an indicator that measures the total amount of fiat supply (priced in US Dollars) issued by the top countries around the world.
Below is the chart shared by Edwards that shows the data for the year-on-year growth in the metric:

As displayed in the graph, the metric’s value has recently been witnessing an increase, indicating that fiat supply is going up. “Central banks are flooding the market with fiat money,” notes the analyst. Currently, the indicator stands at around 9%, which corresponds to the Global Money Supply undergoing a 9% jump over the last twelve months. “This is extreme and rare,” says Edwards.
In the same chart, the Capriole Investments founder has also attached the historical data of the daily Bitcoin price. Interestingly, past surges of the metric to this level all preceded significant bull rallies for the cryptocurrency over the next twelve months.
More specifically, the August 2017 signal led to a 663% surge, the November 2017 one to a 136% increase, and the June 2020 one to a 580% rally. This comes to an average gain of 460%.
Thus, it would appear that money printers being busy around the world is something that tends to be bullish for Bitcoin. Considering that the Global Money Supply is once again rising at an appreciable rate, it only remains to be seen whether BTC will once again feel a positive effect over the coming year.
In some other news, the Bitcoin network recently saw its largest ever movement of coins older than ten years, as CryptoQuant Head of Research Julio Moreno has pointed out in an X post .

In total, this latest spike of transactions involving ancient coins saw the movement of around 81,000 BTC, worth a whopping $8.8 billion. Generally, old coins move when they are being sold, so these transfers could correspond to profit-taking.
Interestingly, the Apparent Demand indicator has remained positive for Bitcoin even after these transactions, as Edwards has explained in another X post .

This metric gauges the demand for Bitcoin by comparing its production (mining issuance) against its inventory (supply inactive over 1 year). “Despite 80,000 BTC moving, Bitcoin’s Apparent Demand is still bullish,” says the analyst.
Bitcoin Price
At the time of writing, Bitcoin is trading around $108,400, up 0.7% over the last week.

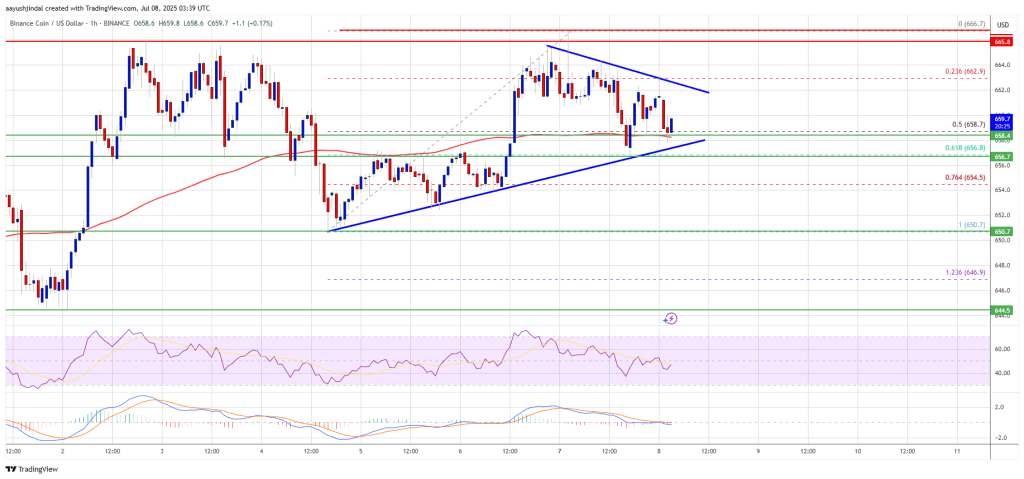
BNB Price Gears Up for Upside Break — Will Bulls Deliver?
BNB price is gaining pace above the $650 support zone. The price is now showing positive signs and m...
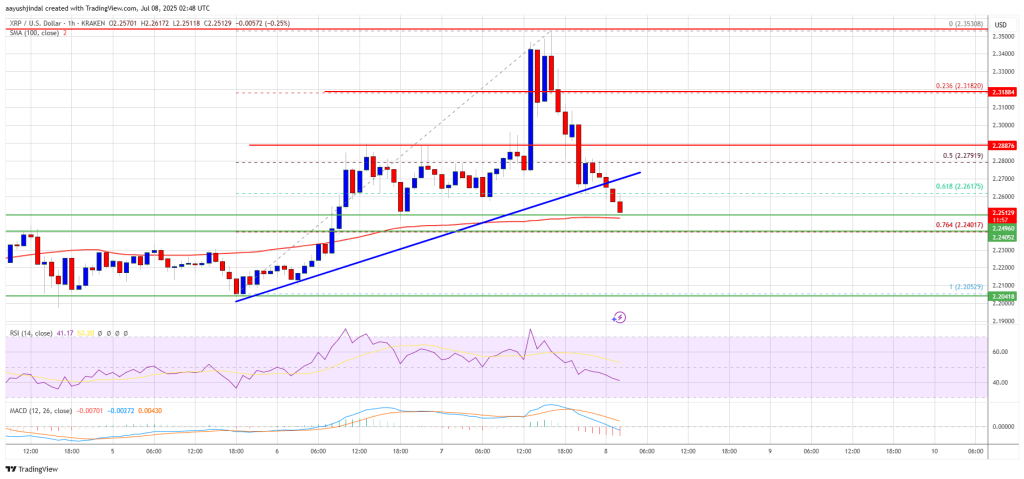
XRP Price Pops and Drops — Can Bulls Regain Control?
XRP price started a strong upward move above the $2.250 zone and tested $2.35. The price is now corr...
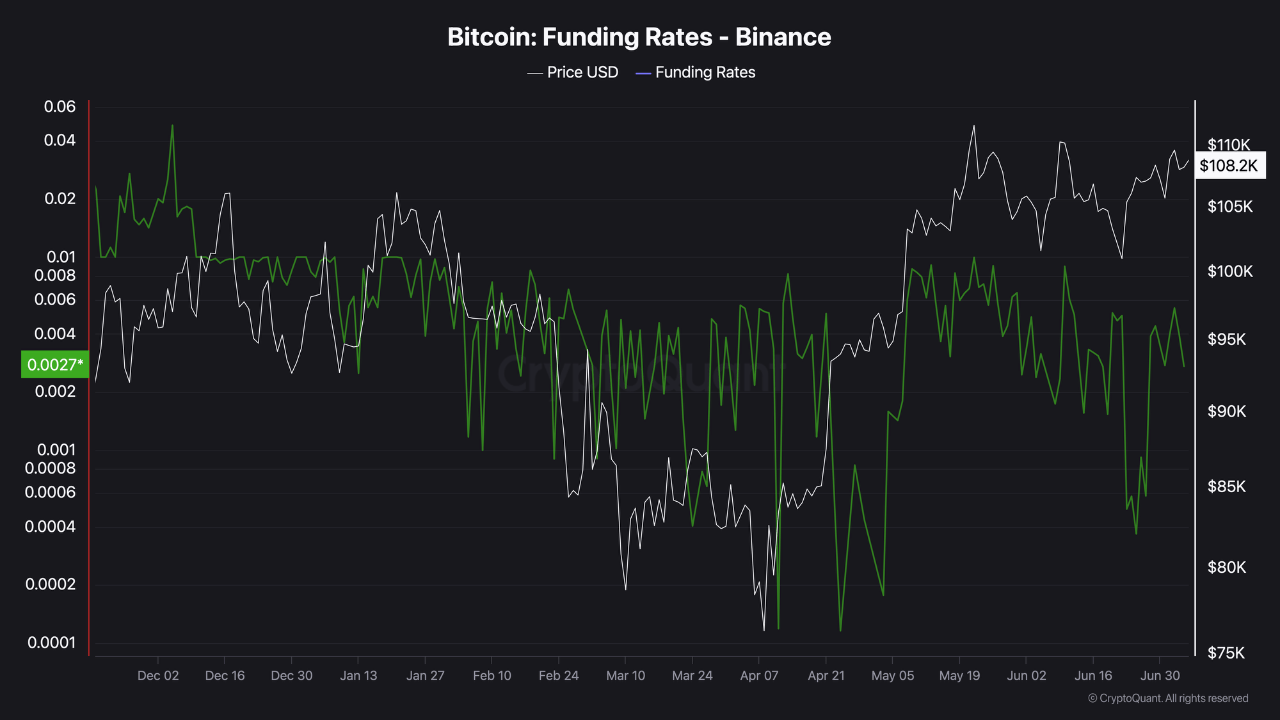
Bitcoin Traders Are Betting Against the Rally, Will It Backfire?
Bitcoin has continued to trade within a tight range just below its previous all-time high, showing r...