Bitcoin Volatility Drops to 7.7% as Bollinger Bands Squeeze Tightens


- Bitcoin’s Bollinger Band squeeze to 7.7% signals low volatility and a likely breakout soon.
- Historical patterns show most squeezes led to bullish moves, though short pullbacks occurred.
- Current consolidation near $70K suggests market energy is building for a directional shift.
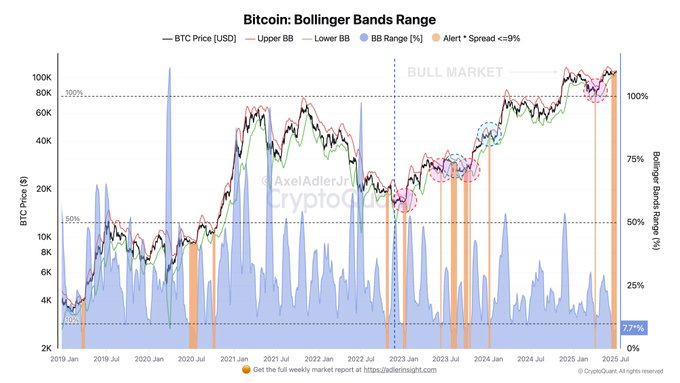
Bitcoin’s volatility has dropped to one of its lowest points in the current bull cycle, signaling a period of energy accumulation that may soon give way to a directional breakout. According to on-chain analyst Axel Adler Jr., the spread between the upper and lower Bollinger Bands has narrowed to just 7.7%, as shown in a recent chart published via CryptoQuant.
The Bollinger Bands indicator, widely used to gauge market volatility, compresses when price movement tightens and expands when volatility increases. Adler notes that this particular 7.7% squeeze is below the 9% mark commonly flagged as a volatility alert zone. In past market cycles, similarly low readings have occurred just before price movements.
Data from the current bull cycle identifies six major squeezes of this kind. Four were immediately followed by upward price movement, while the remaining two experienced pullbacks before resuming growth. This historical pattern does not guarantee future outcomes but highlights the statistical relationship between volatility contraction and market activity.
Price Consolidation Near $70K Precedes the Squeeze
Since early 2024, Bitcoin has remained within the upper zone of its broader trading range. The price has held above $60,000, with recent consolidation occurring near $70,000. During this phase, directional conviction has weakened, resulting in reduced price swings and a steady tightening of the Bollinger Bands.

This extended sideways movement suggests that the market may be preparing for a larger move. The current squeeze is not unprecedented, but its depth, falling below the 8% range, makes it when viewed in context with previous market events. Traders and analysts frequently monitor such periods of reduced volatility for early signs of a breakout.
Prior Squeezes Aligned with Major Market Events
Previous instances of narrow Bollinger Band ranges have often coincided with price shifts. In early 2023, an alarming squeeze occurred just before Bitcoin broke above $40,000. A similar pattern was seen in mid-2020, ahead of a prolonged upward trend.
Although the Bollinger Band squeeze is not ultimately directional, the trend is upwards meaning the bull breakout is likely statistically. However, the short-term consolidation cannot be ruled out before the relevant price shift takes place.
Currently, the market is still in an expectation stage, and traders are paying keen attention to the technical indicators and direction of the market. The 7.7% pinch is a useful technical move, which could plot the short-term Bitcoin charge.

T, AB, GNS, SEI, & HSK Lead Top Crypto Assets in Strong Accumulation Phase, Sets for Price Rally
These are the top crypto assets in a strong accumulation phase across all types of investors, signal...

How InfoFi is Rebuilding People’s Trust in Crypto
InfoFi transforms raw blockchain data into actionable insights, helping rebuild trust in crypto by e...

Price Prediction: Dogecoin Advances Toward $0.20 In July 2025 As Doge And Arctic Pablo Emerge As The Best Crypto To Buy Today
Dogecoin price at $0.1677 backed by whales & bullish analysts. Arctic Pablo joins the best crypto to...


 Adler Jr (@AxelAdlerJr)