Solana (SOL) Spikes to $160 — Will Bulls Power Past This Wall?


Solana started a fresh increase above the $155 zone. SOL price is now consolidating gains and might struggle to rise above the $160 resistance.
- SOL price started a fresh upward move above the $150 and $155 levels against the US Dollar.
- The price is now trading above $152 and the 100-hourly simple moving average.
- There is a key bullish trend line forming with support at $155 on the hourly chart of the SOL/USD pair (data source from Kraken).
- The pair could start a fresh increase if it clears the $160 resistance zone.
Solana Price Aims Higher
Solana price started a decent increase after it cleared the $152 resistance, like Bitcoin and Ethereum . SOL climbed above the $155 level to enter a short-term positive zone.
However, the price is facing a major hurdle at $160 and $162. A high is formed at $159.24 and the price is now consolidating gains above the 23.6% Fib retracement level of the upward move from the $148 swing low to the $160 high.
Solana is now trading above $155 and the 100-hourly simple moving average. There is also a key bullish trend line forming with support at $155 on the hourly chart of the SOL/USD pair.
On the upside, the price is facing resistance near the $160 level. The next major resistance is near the $162 level. The main resistance could be $165. A successful close above the $165 resistance zone could set the pace for another steady increase. The next key resistance is $178. Any more gains might send the price toward the $185 level.
Another Decline in SOL?
If SOL fails to rise above the $160 resistance, it could start another decline. Initial support on the downside is near the $155 zone and the trend line. The first major support is near the $152 level or the 61.8% Fib retracement level of the upward move from the $148 swing low to the $160 high.
A break below the $152 level might send the price toward the $145 zone. If there is a close below the $145 support, the price could decline toward the $136 support in the near term.
Technical Indicators
Hourly MACD – The MACD for SOL/USD is gaining pace in the bullish zone.
Hourly Hours RSI (Relative Strength Index) – The RSI for SOL/USD is above the 50 level.
Major Support Levels – $155 and $152.
Major Resistance Levels – $160 and $162.
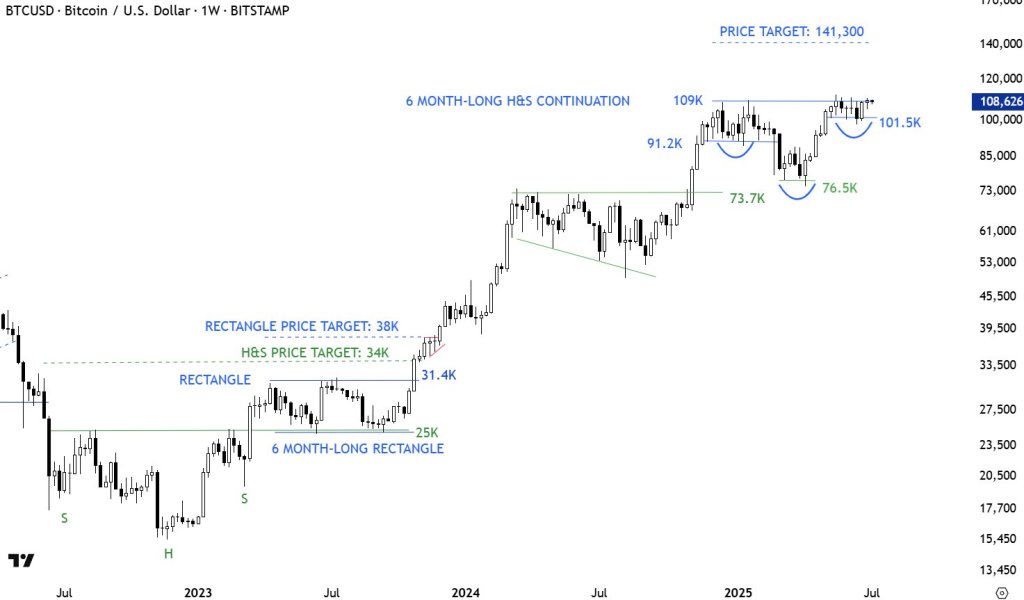
Bitcoin Is One Candle Away From $141,300 Breakout, Chart Master Warns
Top analyst Aksel Kibar (CMT) believes Bitcoin is approaching a decisive moment on the weekly chart....
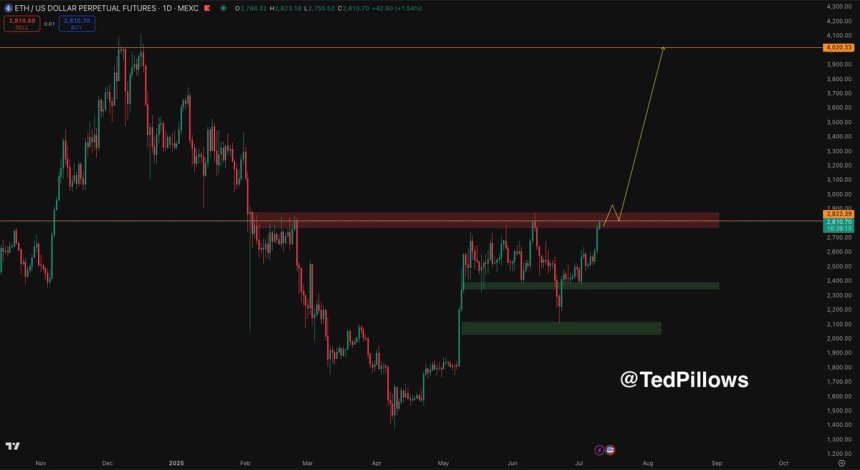
Ethereum Back At Range Highs: Breakout Above $2,800 Could Ignite Altseason
Ethereum surged over 5% yesterday, pushing past the key $2,700 level and signaling renewed strength ...
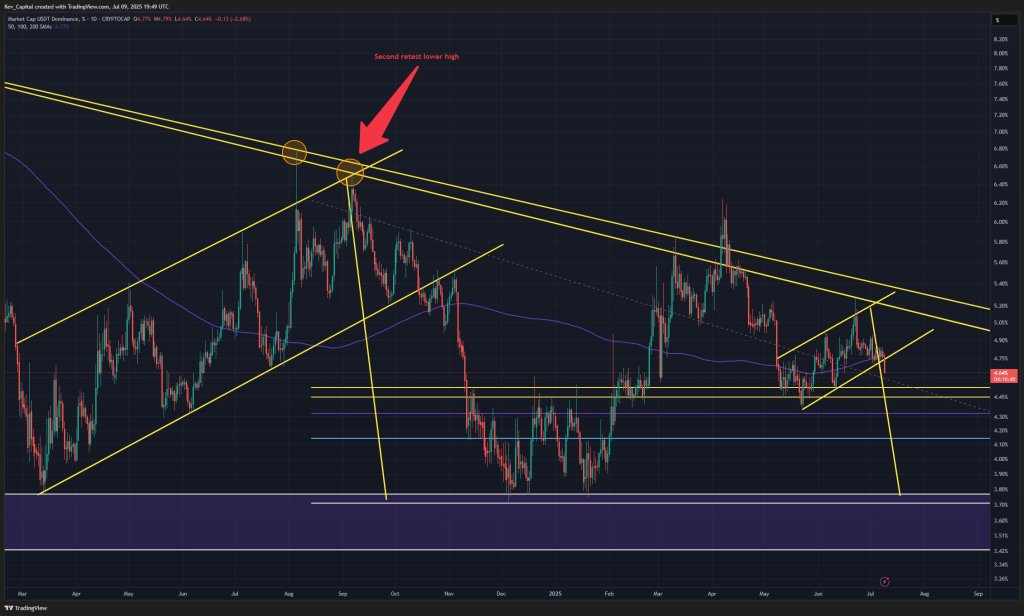
‘Real’ Crypto Bull Run Just Beginning, Says Analyst—Here’s Why
In a livestream broadcast on X, independent market technician Kevin, known online as @Kev_Capital_TA...