Cardano (ADA) Flashes Bullish Signal—Is the Rally Just Beginning?


Cardano price started a fresh increase from the $0.720 zone. ADA is now consolidating and might attempt a clear move above the $0.8650 zone.
- ADA price started a fresh increase from the $0.720 support zone.
- The price is trading above $0.80 and the 100-hourly simple moving average.
- There is a key bullish trend line forming with support at $0.8280 on the hourly chart of the ADA/USD pair (data source from Kraken).
- The pair could start a fresh increase it clears the $0.8650 zone.
Cardano Price Eyes More Gains
In the past few sessions, Cardano saw a decent upward move from the $0.720 zone, like Bitcoin and Ethereum . ADA was able to recover above the $0.750 and $0.80 resistance levels.
The bulls pushed the price above the $0.820 resistance. Finally, it tested the $0.8650 zone. A high was formed at $0.8643 and the price is now consolidating gains above the 23.6% Fib retracement level of the upward move from the $0.7113 swing low to the $0.8643 high.
Cardano price is now trading above $0.820 and the 100-hourly simple moving average. There is also a key bullish trend line forming with support at $0.8280 on the hourly chart of the ADA/USD pair.
On the upside, the price might face resistance near the $0.8650 zone. The first resistance is near $0.880. The next key resistance might be $0.90. If there is a close above the $0.90 resistance, the price could start a strong rally. In the stated case, the price could rise toward the $0.980 region. Any more gains might call for a move toward $1.00 in the near term.
Are Downsides Limited In ADA?
If Cardano’s price fails to climb above the $0.8650 resistance level, it could start another decline. Immediate support on the downside is near the $0.8280 level and the trend line.
The next major support is near the $0.80 level. A downside break below the $0.80 level could open the doors for a test of $0.7880 or the 50% Fib retracement level of the upward move from the $0.7113 swing low to the $0.8643 high. The next major support is near the $0.750 level where the bulls might emerge.
Technical Indicators
Hourly MACD – The MACD for ADA/USD is gaining momentum in the bullish zone.
Hourly RSI (Relative Strength Index) – The RSI for ADA/USD is now above the 50 level.
Major Support Levels – $0.8280 and $0.8000.
Major Resistance Levels – $0.8650 and $0.9000.
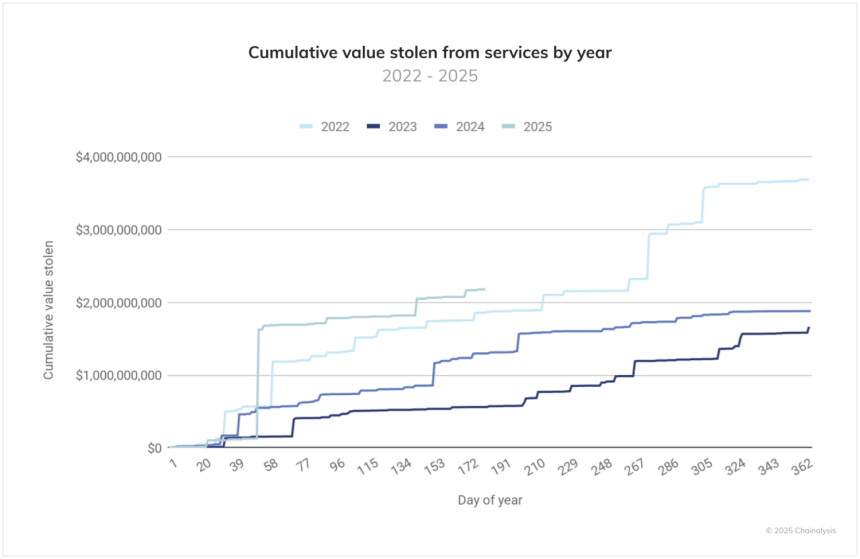
2025 Crypto Thefts Spike: Stolen Funds Hit $2.7 Billion In H1– Report
As the market soars with bullish momentum, crypto theft has also seen a record-breaking performance ...
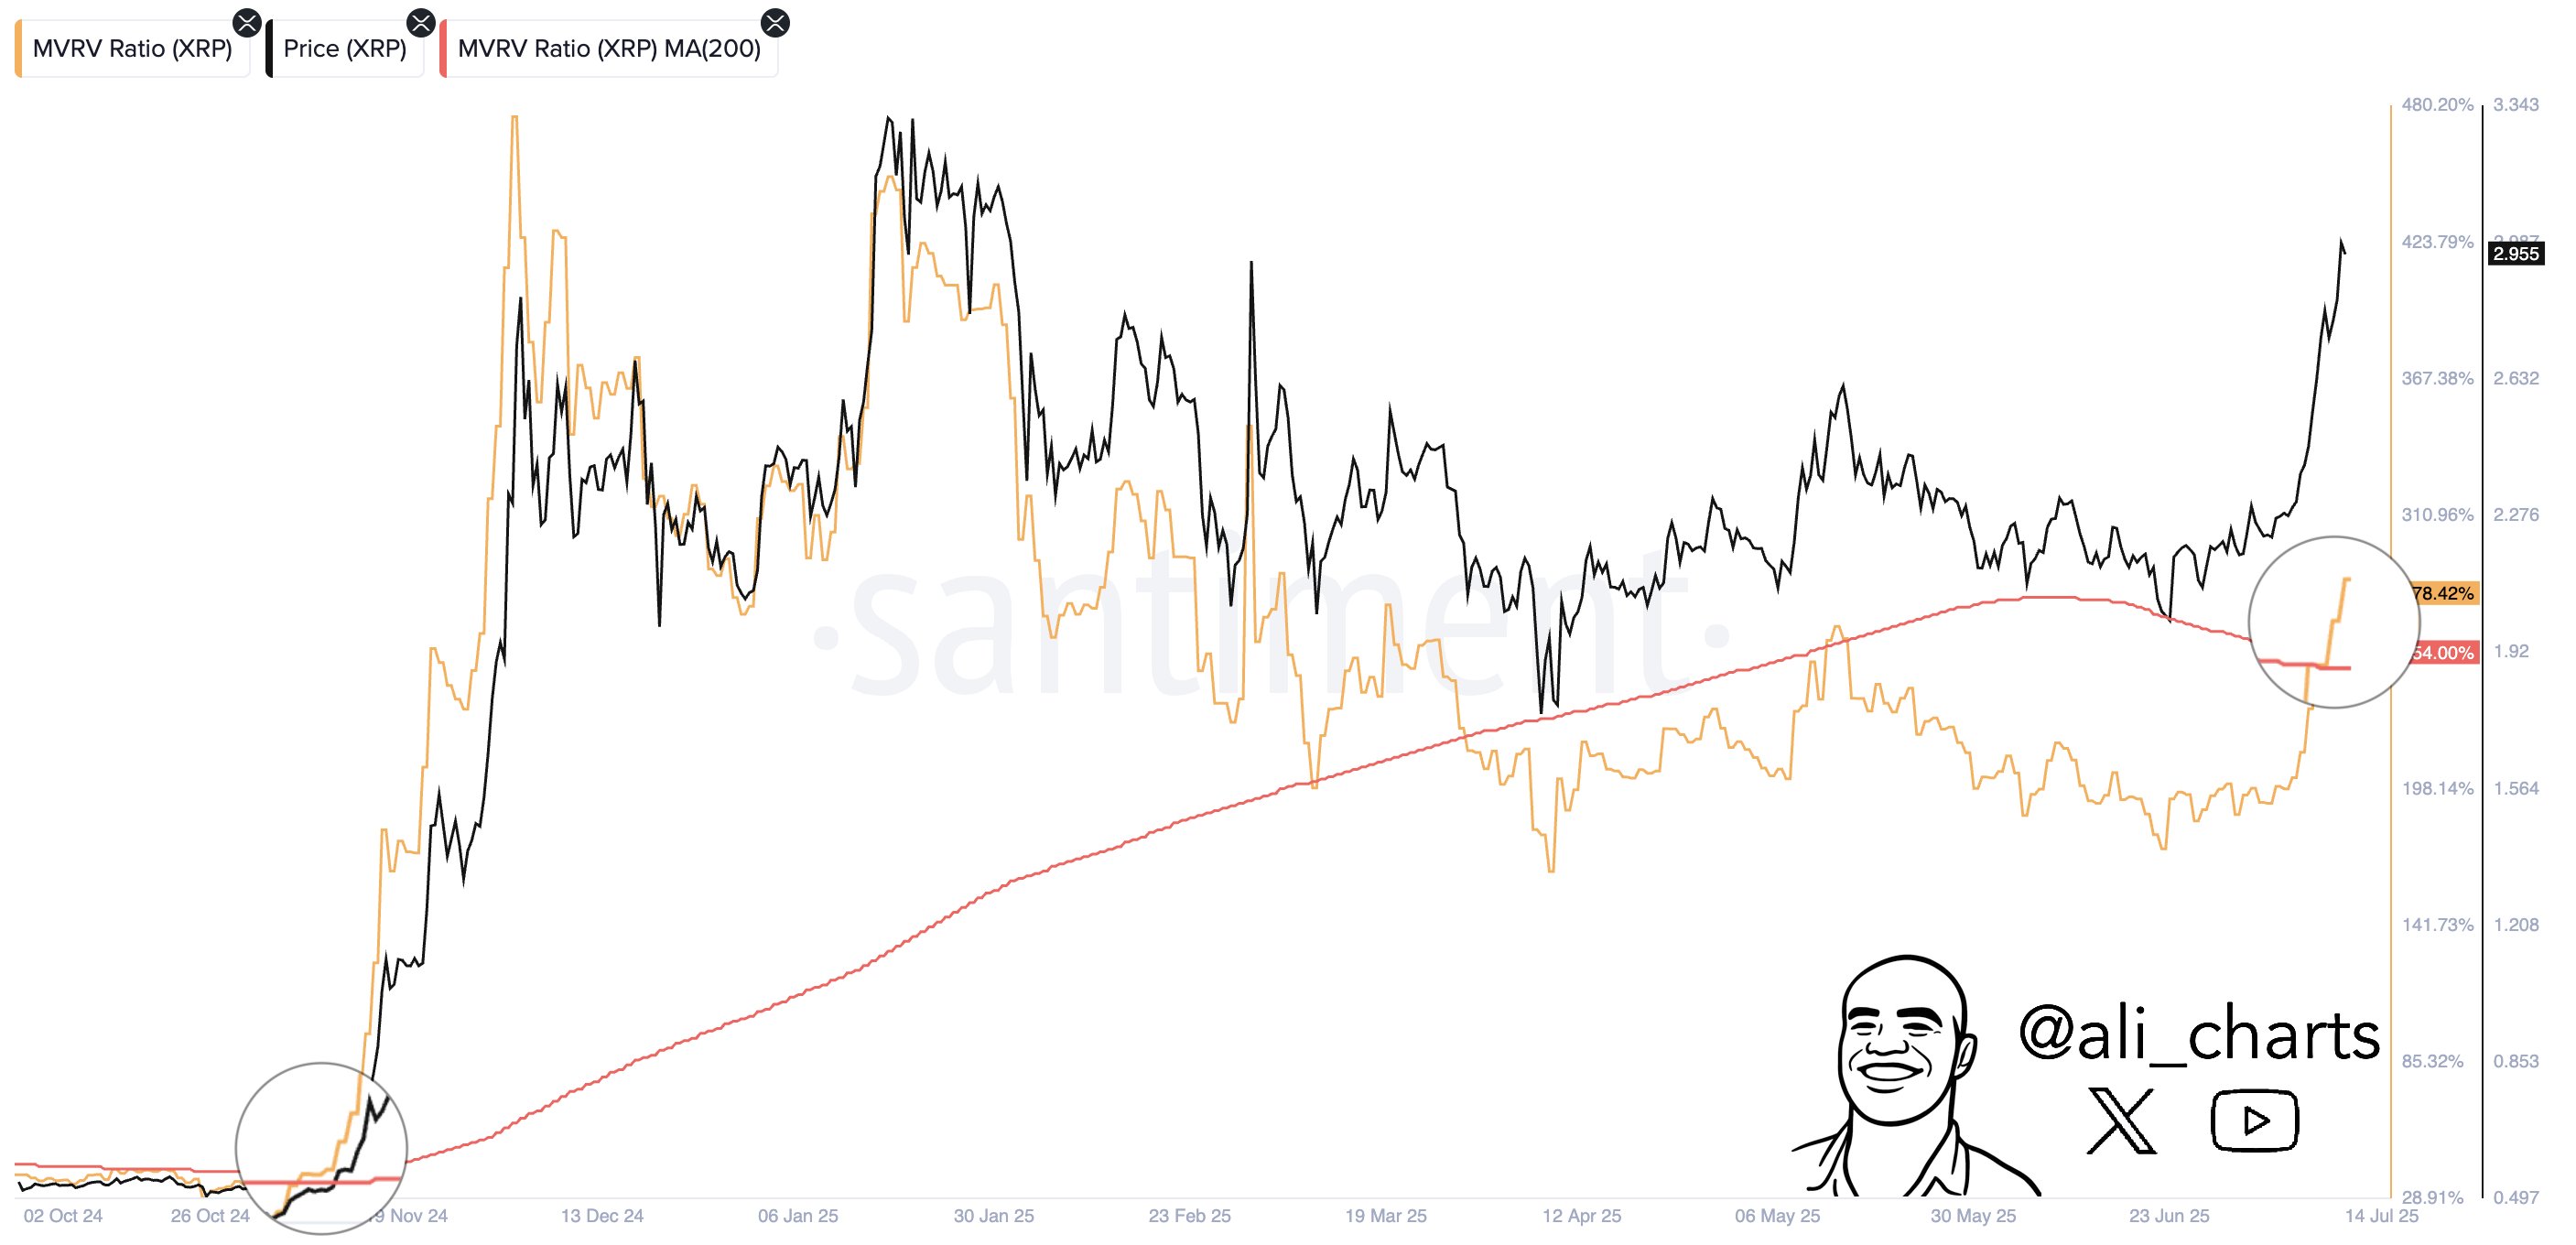
XRP MVRV Ratio Flashes Signal That Last Led To 630% Surge
An analyst has pointed out that the XRP Market Value to Realized Value (MVRV) Ratio has just formed ...
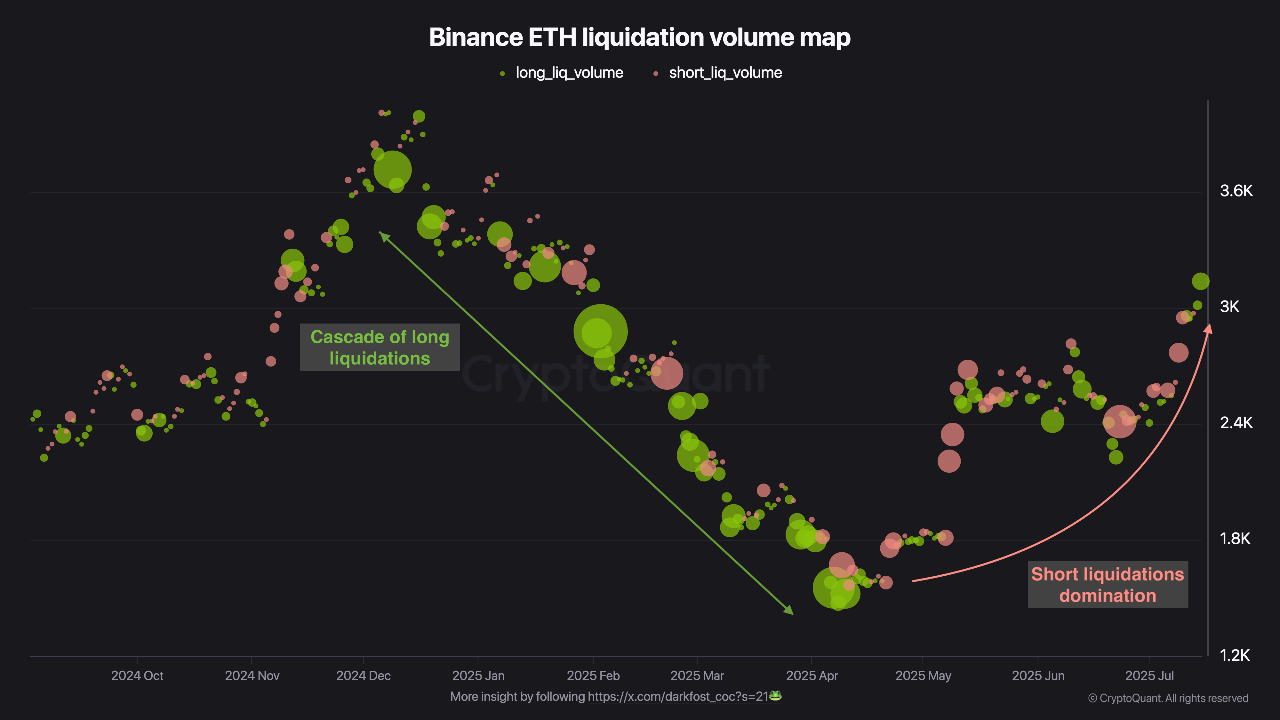
Ethereum Shorts Are Getting Crushed: Could ETH Be Eyeing a New All-Time High?
Ethereum’s recent price trajectory has caught the attention of traders and analysts, as the asset ex...