Pundit Says VeChain Breakout Possible With 340% Gain – Details

Favorite
Share
Scan with WeChat
Share with Friends or Moments
Top crypto analyst Michaël van de Poppe has shared a bullish outlook on VeChain ($VET).
He has predicted that the asset is preparing for a significant breakout, with a potential price target of $0.12 in the coming months.
Double Bottom Structure With Strong Fundamental Indicators
In an
X post today
, van de Poppe highlighted VeChain’s current market structure, noting that the asset has returned to historically strong accumulation levels.
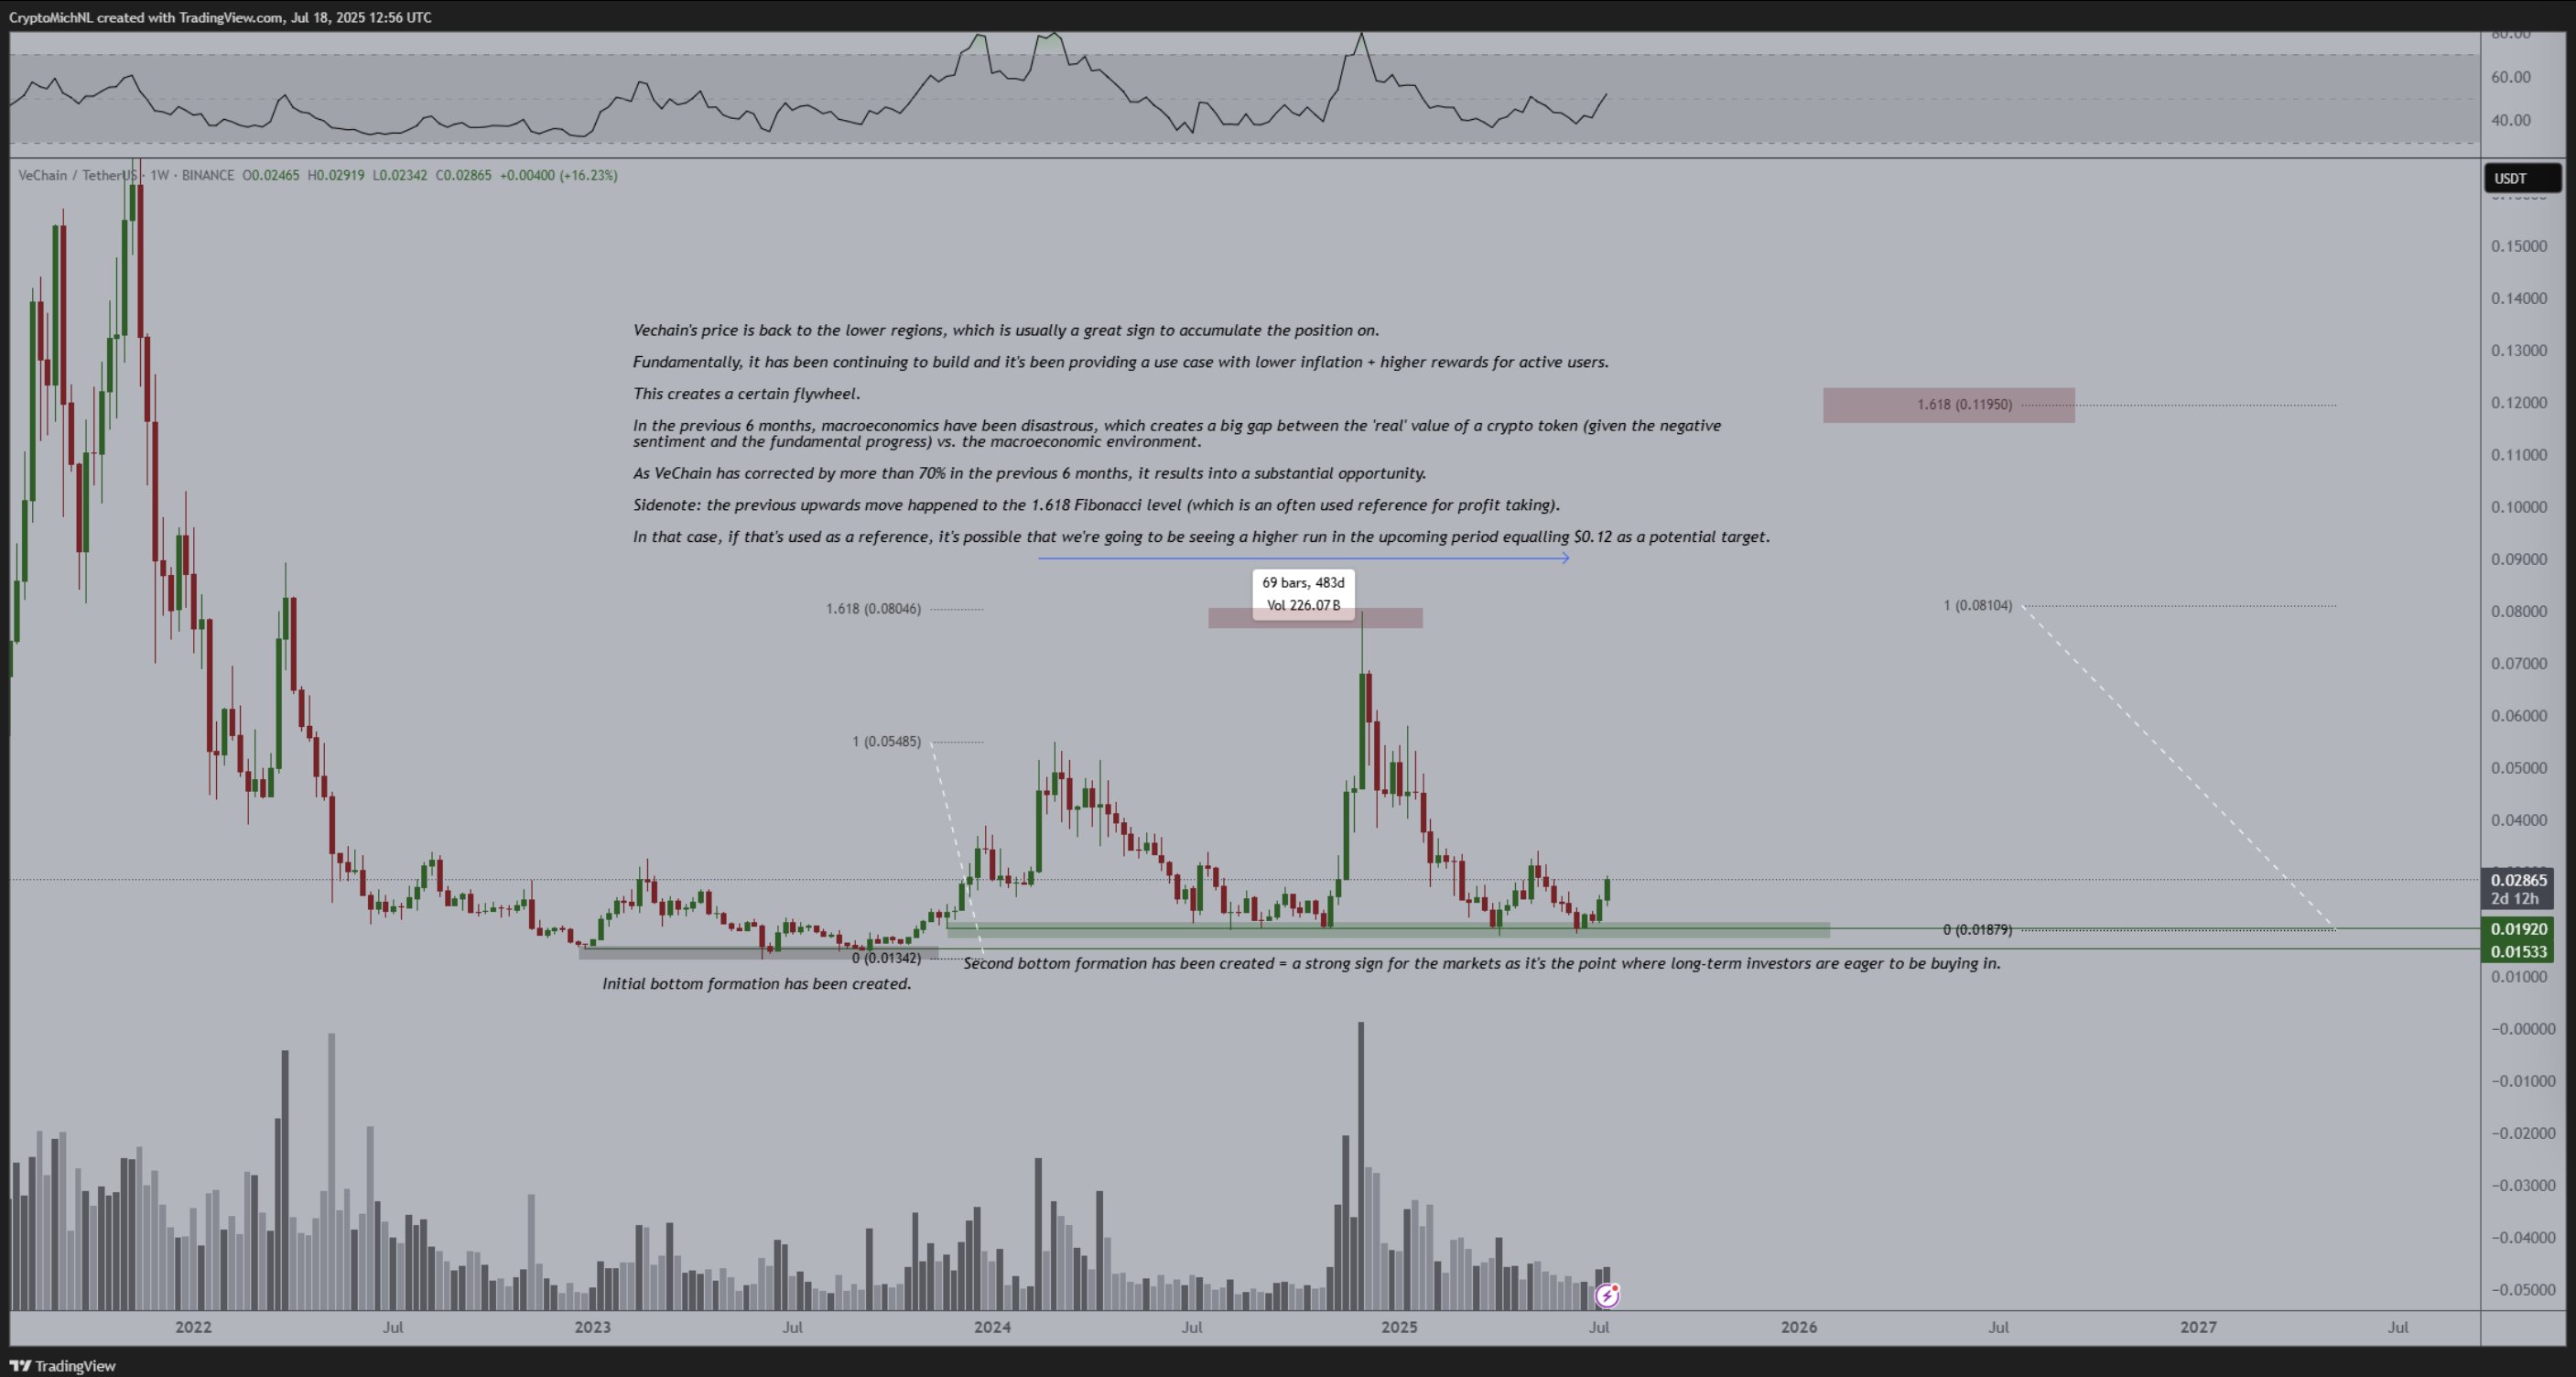 The chart pinpoints a $0.019–$0.028 range as a recurring support level, and $VET’s current $0.0275 places it firmly within this accumulation band. According to the analyst, this is a great sign to accumulate the position as the token has been corrected by more than 70% in the last 6 months.
The chart further shows that VET has created two clear bottom formations over the past two years - first in mid-2023, and again in early 2025. This double-bottom structure is typically seen as a strong reversal signal, especially when coupled with rising volume and positive sentiment shifts.
Fundamentally, van de Poppe pointed out that VeChain has continued to build through the bear market. On July 1, VeChain’s much-anticipated protocol upgrade, Stargate, was successfully launched. He notes that protocol's ongoing developments, combined with lower token inflation and increased user rewards, are creating a “flywheel” effect. In flywheel, as usage grows, rewards also grow with increased user retention. This will likely end up in gain for $VET.
Fibonacci Suggests $0.12 Target - But Not Overnight
Interestingly, the analyst anchored his bullish forecast on a Fibonacci extension pattern. He noted that during $VET’s last major rally, the token peaked at the 1.618 Fibonacci level.
If VeChain repeats this historical price action, van de Poppe believes the asset could be on track for a move toward $0.12. This would mark a more than 340% gain from its current price of $0.027.
However, while technicals suggest a strong base, the chart doesn't imply an immediate surge. Instead, the 69-week arrow implies a patient, multi-month consolidation before a potential breakout.
The chart’s current RSI reading at 41 suggests neutral to mildly oversold conditions. Thus, combined with the current volume build-up and neutral-to-rising RSI, van de Poppe’s view indicates a gradual bullish formation for long-term $VET holders.
The chart pinpoints a $0.019–$0.028 range as a recurring support level, and $VET’s current $0.0275 places it firmly within this accumulation band. According to the analyst, this is a great sign to accumulate the position as the token has been corrected by more than 70% in the last 6 months.
The chart further shows that VET has created two clear bottom formations over the past two years - first in mid-2023, and again in early 2025. This double-bottom structure is typically seen as a strong reversal signal, especially when coupled with rising volume and positive sentiment shifts.
Fundamentally, van de Poppe pointed out that VeChain has continued to build through the bear market. On July 1, VeChain’s much-anticipated protocol upgrade, Stargate, was successfully launched. He notes that protocol's ongoing developments, combined with lower token inflation and increased user rewards, are creating a “flywheel” effect. In flywheel, as usage grows, rewards also grow with increased user retention. This will likely end up in gain for $VET.
Fibonacci Suggests $0.12 Target - But Not Overnight
Interestingly, the analyst anchored his bullish forecast on a Fibonacci extension pattern. He noted that during $VET’s last major rally, the token peaked at the 1.618 Fibonacci level.
If VeChain repeats this historical price action, van de Poppe believes the asset could be on track for a move toward $0.12. This would mark a more than 340% gain from its current price of $0.027.
However, while technicals suggest a strong base, the chart doesn't imply an immediate surge. Instead, the 69-week arrow implies a patient, multi-month consolidation before a potential breakout.
The chart’s current RSI reading at 41 suggests neutral to mildly oversold conditions. Thus, combined with the current volume build-up and neutral-to-rising RSI, van de Poppe’s view indicates a gradual bullish formation for long-term $VET holders.
Disclaimer: This article is copyrighted by the original author and does not represent MyToken’s views and positions. If you have any questions regarding content or copyright, please contact us.(www.mytokencap.com)contact
About MyToken:https://www.mytokencap.com/aboutusArticle Link:https://www.mytokencap.com/news/518426.html
Related Reading
SharpLink Gaming Acquires 79,949 Ethereum in Largest Weekly Crypto Purchase
U.S.-listed SharpLink Gaming, Inc. has significantly expanded its Ethereum (ETH) reserves.Today, i...
Major US Bank PNC to Power Crypto Trading for Clients
PNC Bank has officially entered the crypto space through a strategic partnership with Coinbase, one ...
Ethereum Michael Saylor Says No to Bitcoin: “I’d Rather Have an iPhone Than a Landline”
Andrew Keys, the co-founder and chairman of the Ether Machine, says no to Bitcoin, suggesting that E...