TRON (TRX) Above $0.31, But Is It Just the Beginning? Key Metric Shows Buyers Dominating


TRON (TRX) has experienced a steady upward price movement alongside broader market gains. Over the past week, the asset has climbed over 5%, recently crossing the $0.31 mark and currently trading around $0.3132.
This recent performance reflects growing interest in the TRX market, supported by on-chain signals suggesting continued buyer dominance. One of the more notable observations comes from on-chain analyst Maartunn, who shared his latest insights on CryptoQuant’s QuickTake platform.
His focus centers on the Spot Taker CVD (Cumulative Volume Delta) metric, a tool that tracks the net difference between market buys and sells.
Spot Taker CVD Signals Buyer Dominance
According to the analyst, the data currently points to sustained buying pressure , a potentially significant trend for TRX’s near-term trajectory. Maartunn’s post titled “TRON: Spot Taker CVD shows Taker Buy Dominant” explores how cumulative market order activity can provide context for TRX’s current momentum.
He explains that Spot Taker CVD is calculated by summing the difference between market buy (taker buy) and market sell (taker sell) volumes over a 90-day period. When the CVD is rising and positive, it suggests a buyer-dominant phase, which often coincides with upward price action.

“Currently, the indicator shows that Taker Buy Volume is dominant,” Maartunn wrote. He noted this trend tends to align with price increases, as it reflects more aggressive buying behavior in the market.
This buying pressure, according to the analysis, is likely fueled by factors such as increased TRON network usage and recent ecosystem developments , including the debut of the first TRX Treasury Company and continued stablecoin activity on the chain.
TRON Network Stability and User Participation Add Context
While the CVD trend highlights the market’s appetite for TRX, other indicators help build a broader view. A separate post by CryptoQuant analyst CryptoOnchain highlighted improvements in the TRON network’s stability.
According to on-chain data, the network is currently producing around 28,500 blocks per day, with minimal volatility, suggesting a more reliable infrastructure capable of handling high transaction volumes.
These developments are supported by technical upgrades, including the Dynamic Energy Model (Proposal #84), enhanced staking yields that reach up to 7.31%, and professional security audits.

TRON also recorded more than 780 million transactions in Q2 2025, representing a 37% increase year-over-year. Despite this heavy throughput, the network has maintained consistent block production.
Taken together, the sustained taker buy dominance, strong technical performance, and growing user participation indicate that TRON is experiencing both market and infrastructure-driven momentum. If buying pressure continues and network trends hold, TRX could be positioned for further growth in the coming months.

Featured image created with DALL-E, Chart from TradingView
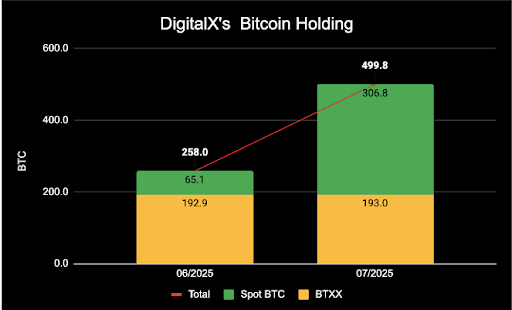
This Australian Investment Manager Just Added Bitcoin To Its Treasury, Here’s How Much BTC They’ve Bought
DigitalX Limited, an Australian digital Investment manager, has made headlines with a new Bitcoin (B...
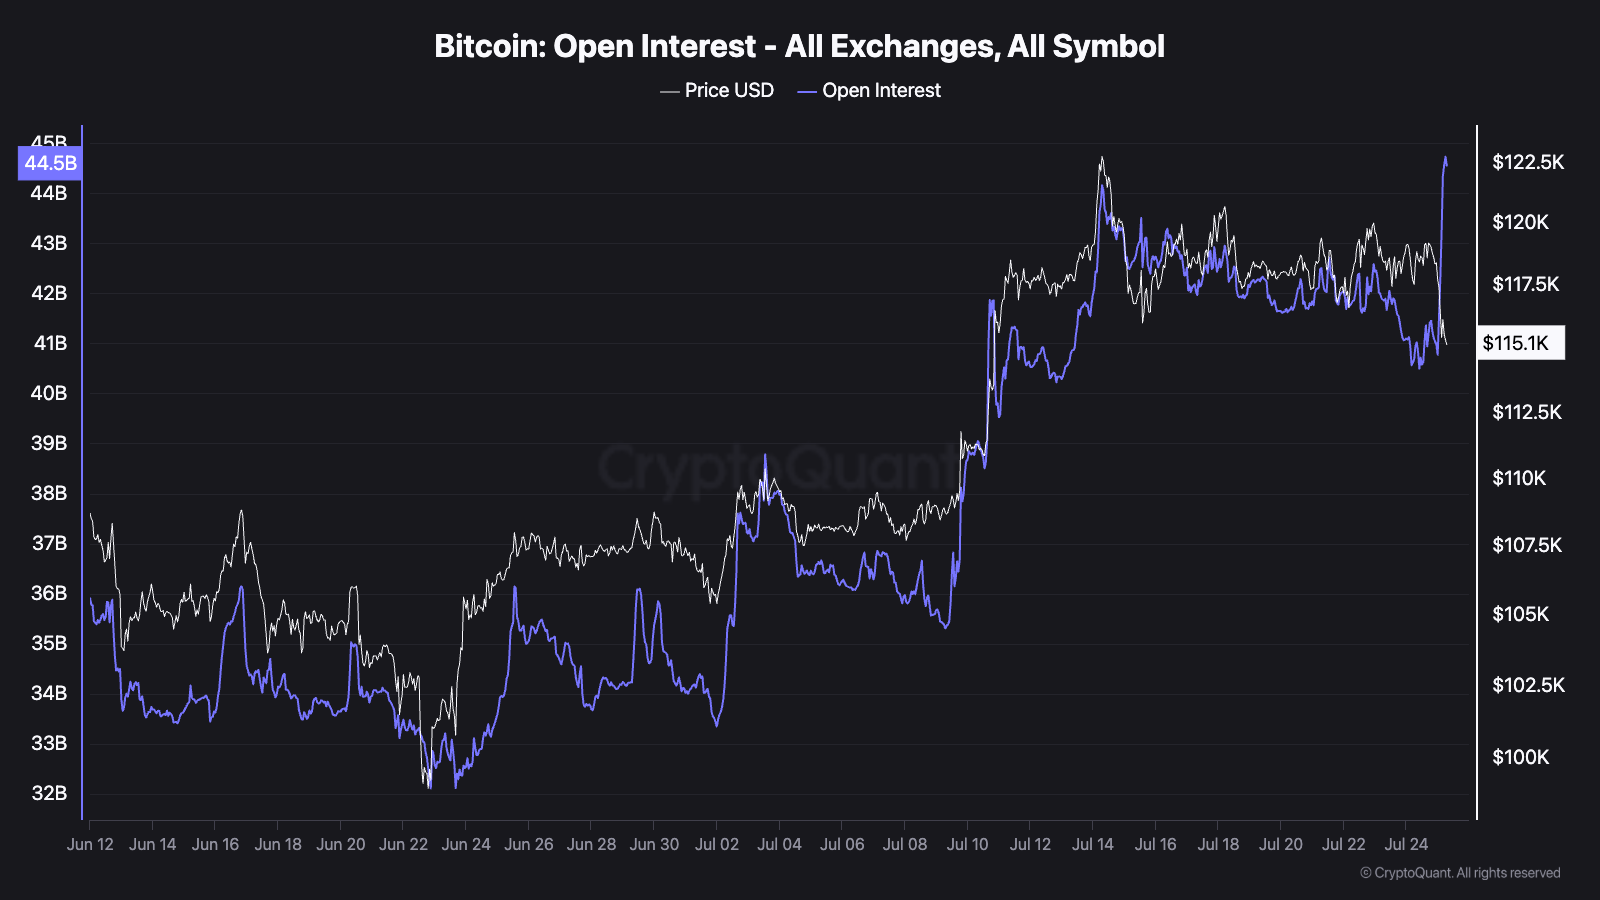
Bitcoin Open Interest Sets New Record As Price Plunges To $115,000
Data shows the Bitcoin Open Interest shot up to a new all-time high (ATH) even as the cryptocurrency...
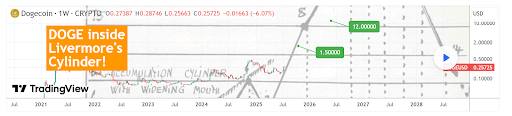
Dogecoin Price Enters Bullish Livermore Cylinder That Could Catapult Price To $1.5
Crypto analyst TradingShot has revealed that the Dogecoin price has entered a bullish pattern, which...