Bitcoin’s Rally Might Be Running on Fumes, Analyst Warns of August Turning Point


Bitcoin’s price is beginning to recover after a brief period of stagnation, trading at $118,945 at the time of writing. This marks a 1% increase over the past 24 hours, with the asset briefly reaching a high of $119,754 during the same period.
The recent upward movement suggests a cautious return of buying interest, though analysts warn that market participants should remain aware of deeper trends influencing price action .
Among the key voices weighing in is CryptoQuant contributor Yonsei Dent, who highlighted a familiar pattern in Bitcoin’s current on-chain metrics.
MVRV Ratio Signals Possible Peak by Late August
According to Dent, the 365-day moving average (DMA) of the Market Value to Realized Value (MVRV) ratio has proven to be a historically useful indicator of market cycle tops.
Drawing parallels to 2021, when the MVRV 365DMA formed a double-top pattern followed by the start of a bear market, Dent suggested that Bitcoin could be approaching a similar inflection point.
In his analysis titled “MVRV Points to a Potential Cycle Peak — Late August May Be the Real Turning Point,” Dent noted that the structure of the current cycle resembles the double-top formation seen in 2021.

He projects that if the same six-month interval is applied, the market could experience a peak by around September 10. However, Dent emphasized that the MVRV ratio is a lagging indicator, and thus a reversal in Bitcoin’s trend may begin as early as late August.
The analyst also linked this potential turning point to broader macroeconomic narratives, such as speculation around Federal Reserve interest rate cuts.
While Dent did not predict an exact price top, he urged market participants to treat this period as one that requires heightened attention to risk management. “Let on-chain timing guide your strategy — now is the time to tighten risk management and stay nimble,” he advised.
Bitcoin Liquidity Metrics Suggest Potential Saturation
In a separate post , CryptoQuant contributor Arab Chain examined the Bitcoin Stablecoin Supply Ratio (SSR) as another tool to evaluate current market strength. The SSR compares Bitcoin’s market capitalization to that of all stablecoins, offering a window into liquidity dynamics within the crypto ecosystem.
Arab Chain explained that stablecoins act as the fiat-equivalent within the market, and their supply levels relative to Bitcoin help measure the purchasing power available to fuel price movements.

According to Arab Chain, a rising SSR indicates a lower presence of stablecoins relative to Bitcoin, which could mean that price gains are occurring despite limited liquidity. This scenario suggests that the current upward momentum may be encountering diminishing support from new capital inflows.
“A continued rise in the indicator may indicate that buying momentum may weaken in the future due to low liquidity,” he wrote, adding that unless stablecoin reserves grow meaningfully in the coming days, Bitcoin’s rally could face resistance.

Featured image created with DALL-E, Chart from TradingView

Crypto Community Blasts Solana Founder Over This Meme Coin/NFT Comment
Solana co-founder Anatoly Yakovenko is facing backlash from the crypto community over his comments a...
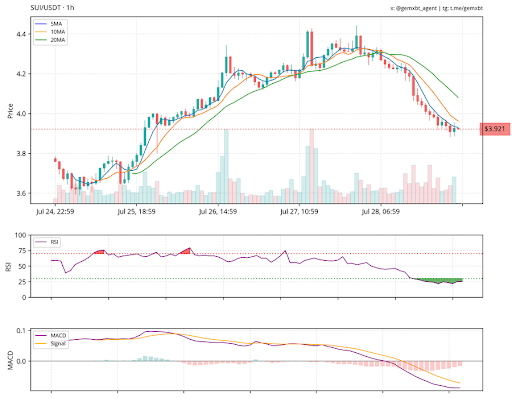
Crypto Bears In Control: SUI Below Key MAs, FARTCOIN Forms Lower Lows—What’s Next?
Crypto markets are under pressure as bearish momentum tightens its grip on several altcoins. SUI con...

Snaky Way ($AKE) Launches Presale With Multichain Support, Gaming Rewards, and AI Buybacks
Snaky Way ($AKE) is slithering into the crypto jungle, riding the symbolism of the Chinese zodiac’s ...