XRP To $12? Analyst Reveals Bold Target From Multi-Year Pattern


An analyst has pointed out how the breakout from this multi-year long XRP triangle pattern could point to a massive bullish target for the asset’s price.
XRP Has Been Shooting Up Since Breaking Out Of This Triangle
In a new post on X, analyst Ali Martinez has talked about a multi-year technical analysis (TA) pattern in XRP’s weekly price chart. The pattern in question is a triangle , which forms whenever an asset trades between two converging trendlines.
The upper line of the pattern is likely to provide resistance, while the lower one support. A break out of either of these levels can hint at a continuation of trend in that direction; a surge above the triangle can be a bullish signal, while a drop under it a bearish one.
Triangles can be of a few types, with three popular ones being the ascending, descending, and symmetrical variations. The orientation of the trendlines decides which category a specific triangular channel belongs to.
One trendline being parallel to the time-axis means that the pattern is one of the first two types. More specifically, it’s an ascending triangle if the upper line is parallel, while it’s a descending one in the case of a flat lower line.
When both trendlines approach each other at a roughly equal and opposite angle, the symmetrical triangle forms. In the context of the current topic, the triangle of interest is closest to this type.
Below is the chart shared by Martinez that shows the long-term triangle that the 7-day price of XRP was trading inside before its earlier breakout.
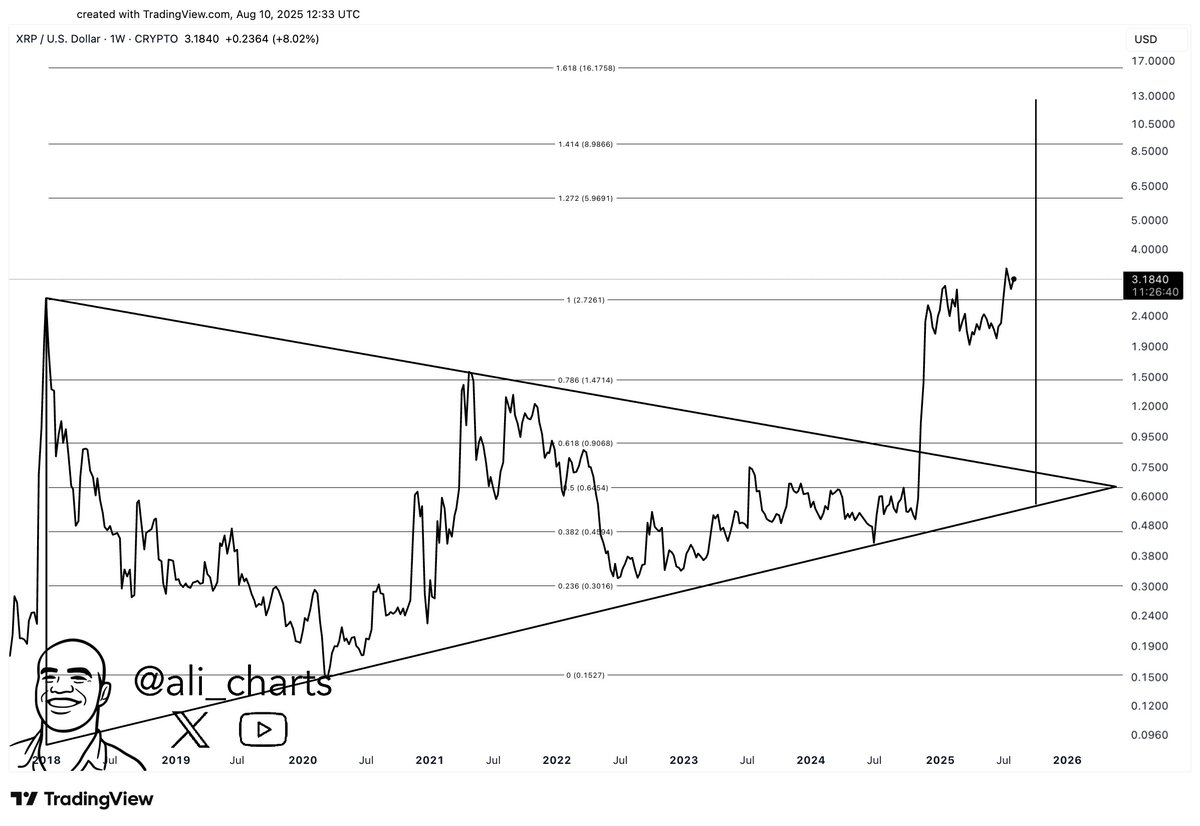
As is visible in the graph, the weekly XRP price was trading inside a pattern that looked like a symmetrical triangle with a slight upward bias between 2018 and 2024. In a proper symmetrical triangle, the probability of a breakout occurring is considered the same in either direction, but considering that this triangle was angled upward, a bullish breakout may have been more likely.
And indeed, in November 2024, the asset managed to break past the upper boundary of the formation, kickstarting a bull rally . Generally, triangle breakouts are considered to be of the same length as the height of the pattern. That is, the resulting move in the price may be equal to the distance between the trendlines at their widest.
In the chart, Martinez has highlighted what the target could be for XRP, based on this idea: $12.60. From the current value of the cryptocurrency, a run to this level would imply an increase of almost 287%. It now remains to be seen whether the pattern would hold up for the token.
XRP Price
XRP recovered above $3.37 earlier, but the coin has since seen a retrace as its price is back at $3.25.

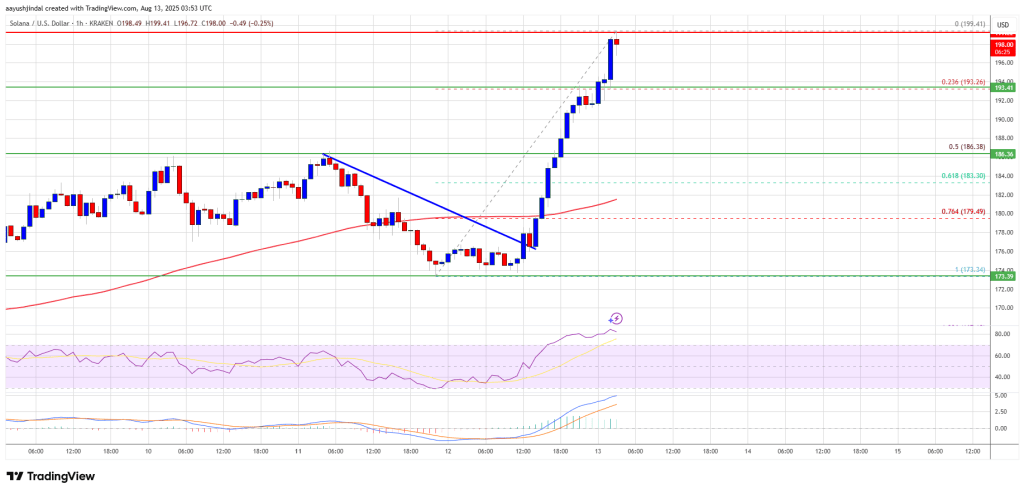
Solana (SOL) Jumps 10%, Bulls Set Sights on a $200 Breakout
Solana started a fresh increase from the $175 zone. SOL price is now up nearly 10% and might aim for...
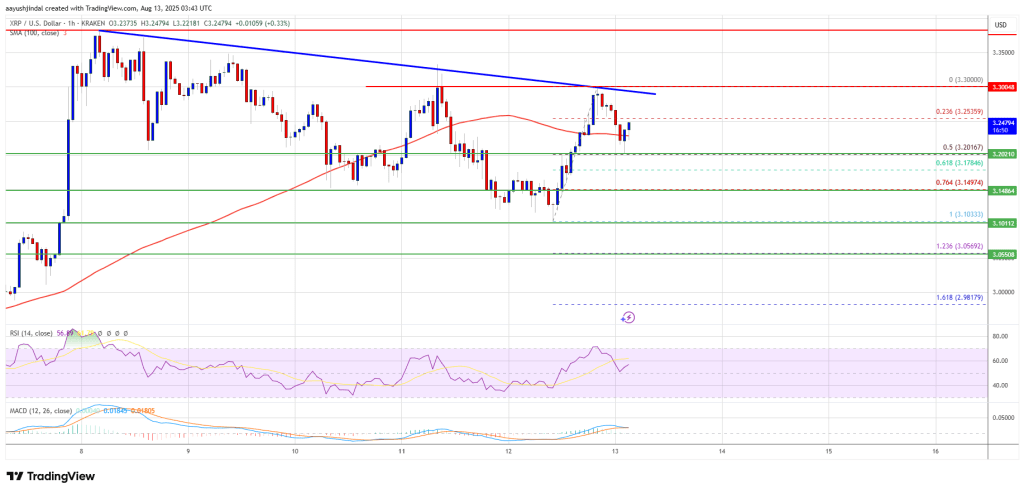
XRP Price Coiling for a Breakout—Will This Spark the Next Surge Higher?
XRP price is consolidating gains below the $3.320 zone. The price is showing positive signs and migh...
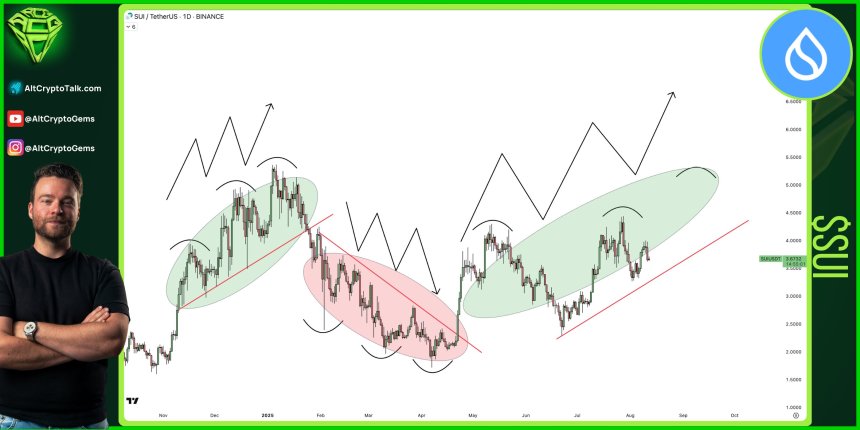
SUI Set Up For Another Leg? Analyst Forecasts $10 Target For Potential Breakout
Sui (SUI) is attempting to reclaim a key resistance area after recovering from last week’s lows and ...