Why is Bitcoin Price Down Today? How Low Can BTC Price Go?


The post Why is Bitcoin Price Down Today? How Low Can BTC Price Go? appeared first on Coinpedia Fintech News
Bitcoin price today pulled back sharply after touching $123,000, triggering more than $800 million in long liquidations across crypto markets. Analysts warn of near-term weakness but maintain that the broader uptrend remains intact.
The world’s largest cryptocurrency briefly broke above its major horizontal range before facing heavy selling pressure. The rejection sent prices back toward the mid-point of the range, a level many traders view as pivotal in determining whether the rally can sustain.
“The market absorbed liquidity above recent highs and quickly rejected,” one analyst noted . “Greed was evident, and traders failed to take profits at resistance.”
Bitcoin Price Forecast
On higher timeframes, Bitcoin remains in an uptrend, consistently forming higher highs and higher lows. Yet on the one-hour chart, the asset has posted its first lower low in weeks, a shift that suggests short-term bearish momentum.
Key technical levels:
-
Resistance
: $120,000, marked by the value area high and anchored VWAP. Sustained recovery above this level would be viewed as confirmation of renewed strength.
-
Immediate Support
: $118,200, the point of control where the heaviest trading volume has accumulated.
-
Major Support
: $116,300, a confluence of the golden Fibonacci pocket, daily support, and the 200-day exponential moving average.
“This alignment of factors makes $116,000 to $117,000 a critical zone for Bitcoin,” the analyst added .
Sentiment and Risk
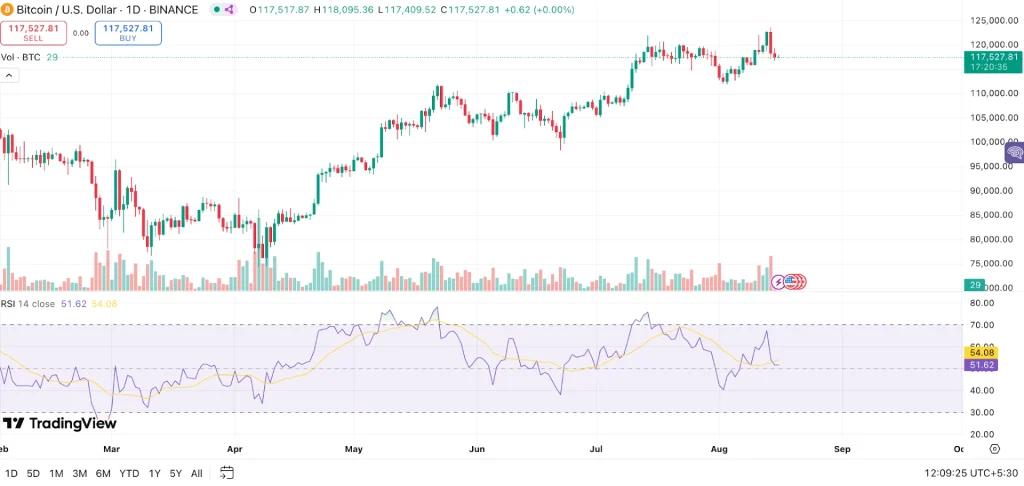
Momentum indicators are split. The four-hour chart displays a hidden bullish divergence on the RSI , indicating potential for a rebound, while the daily chart signals bearish divergence, suggesting the possibility of a larger corrective phase.
- Also Read :
- Ethereum Price Prediction: Could ETH Rally to $15,000 in the Next Cycle?
- ,
Ethereum, the second-largest cryptocurrency, has also shown signs of volatility. While it may still attempt a new all-time high, traders are preparing for potential liquidity-driven reversals at elevated levels.
If Bitcoin holds the $116,300 support level, a move back toward $120,000 is expected, with a potential extension to $128,000 . Failure to maintain support, however, could trigger a broader retracement, potentially marking the start of a corrective wave after months of gains.
Never Miss a Beat in the Crypto World!
Stay ahead with breaking news, expert analysis, and real-time updates on the latest trends in Bitcoin, altcoins, DeFi, NFTs, and more.


FAQs
Bitcoin faced heavy selling at resistance, triggering $800M in long liquidations and a sharp pullback.
Yes, higher timeframes show BTC remains bullish with higher highs, though short-term charts hint weakness.
Ethereum shows volatility alongside BTC, with traders bracing for liquidity-driven reversals at highs.
If BTC breaks support, ETH could mirror the decline, signaling a broader crypto market correction.
Analysts note ETH’s strong momentum; if network demand rises, ETH may outperform BTC in select phases.

Ripple News: Trump Jr. Rumored to Eye XRP as Expert Backs Crypto Adoption
The post Ripple News: Trump Jr. Rumored to Eye XRP as Expert Backs Crypto Adoption appeared first on...

This Shiba Inu Alternative Could Soar 5000% as SHIB Targets $0.000030
The post This Shiba Inu Alternative Could Soar 5000% as SHIB Targets $0.000030 appeared first on Coi...

Lagrange Price Jumps 24% as Breakout Signals Bullish Momentum
The post Lagrange Price Jumps 24% as Breakout Signals Bullish Momentum appeared first on Coinpedia F...