Solana (SOL) Falls Below Support, Will Bears Extend the Decline?


Solana started a fresh decline from the $210 zone. SOL price is now showing bearish signs and might decline below the $172 support zone.
- SOL price started a fresh decline after it failed to clear $210 against the US Dollar.
- The price is now trading below $185 and the 100-hourly simple moving average.
- There is a connecting bearish trend line forming with resistance at $188 on the hourly chart of the SOL/USD pair (data source from Kraken).
- The pair could start a fresh increase if it clears the $188 resistance zone.
Solana Price Dips Again
Solana price failed to clear the $210 zone and started a fresh decline, like Bitcoin and Ethereum . SOL traded below the $200 and $188 support levels to enter a short-term bearish zone.
The bears were able to push the price below the 50% Fib retracement level of the upward move from the $173 swing low to the $209 high. There is also a connecting bearish trend line forming with resistance at $188 on the hourly chart of the SOL/USD pair.
Solana is now trading below $185 and the 100-hourly simple moving average. It is also below the 76.4% Fib retracement level of the upward move from the $173 swing low to the $209 high.
On the upside, the price is facing resistance near the $182 level. The next major resistance is near the $184 level. The main resistance could be $188. A successful close above the $188 resistance zone could set the pace for another steady increase. The next key resistance is $192. Any more gains might send the price toward the $200 level.
More Losses In SOL?
If SOL fails to rise above the $182 resistance, it could continue to move down. Initial support on the downside is near the $175 zone. The first major support is near the $172 level.
A break below the $172 level might send the price toward the $162 support zone. If there is a close below the $162 support, the price could decline toward the $150 support in the near term.
Technical Indicators
Hourly MACD – The MACD for SOL/USD is gaining pace in the bearish zone.
Hourly Hours RSI (Relative Strength Index) – The RSI for SOL/USD is below the 50 level.
Major Support Levels – $172 and $162.
Major Resistance Levels – $182 and $188.
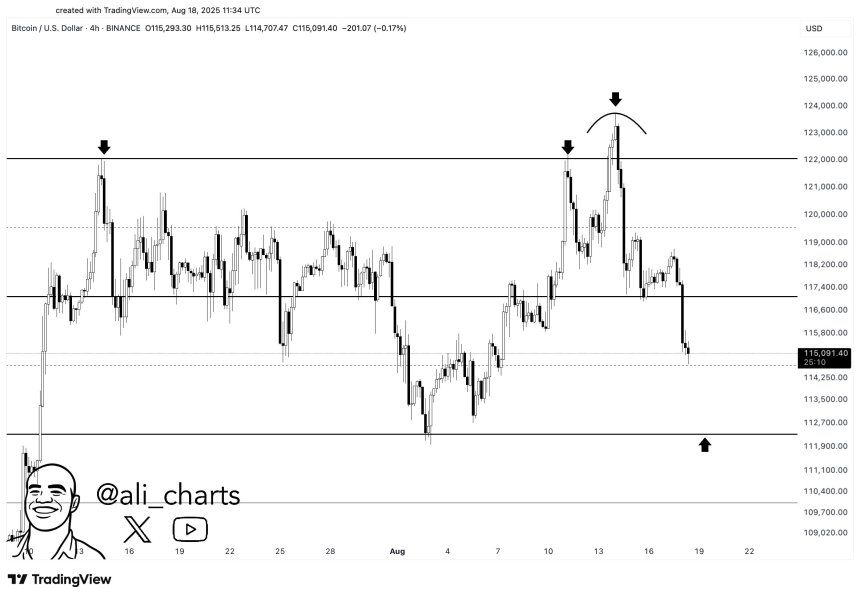
Bitcoin Risks Drop Below $110,000 Despite Bounce – Is A 15% Pullback Coming?
Bitcoin (BTC) is attempting to reclaim a crucial level as support after bouncing from the recent dro...
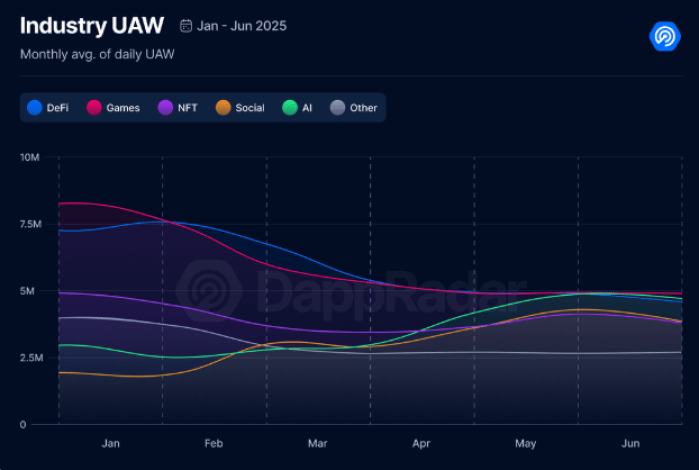
Tapzi Launches Presale, Bets on Skill-to-Earn as Web3 Gaming Chases Sustainable Models
GameFi is broken – if it ever worked to begin with. Play-to-earn relied on complicated tokenomics (o...
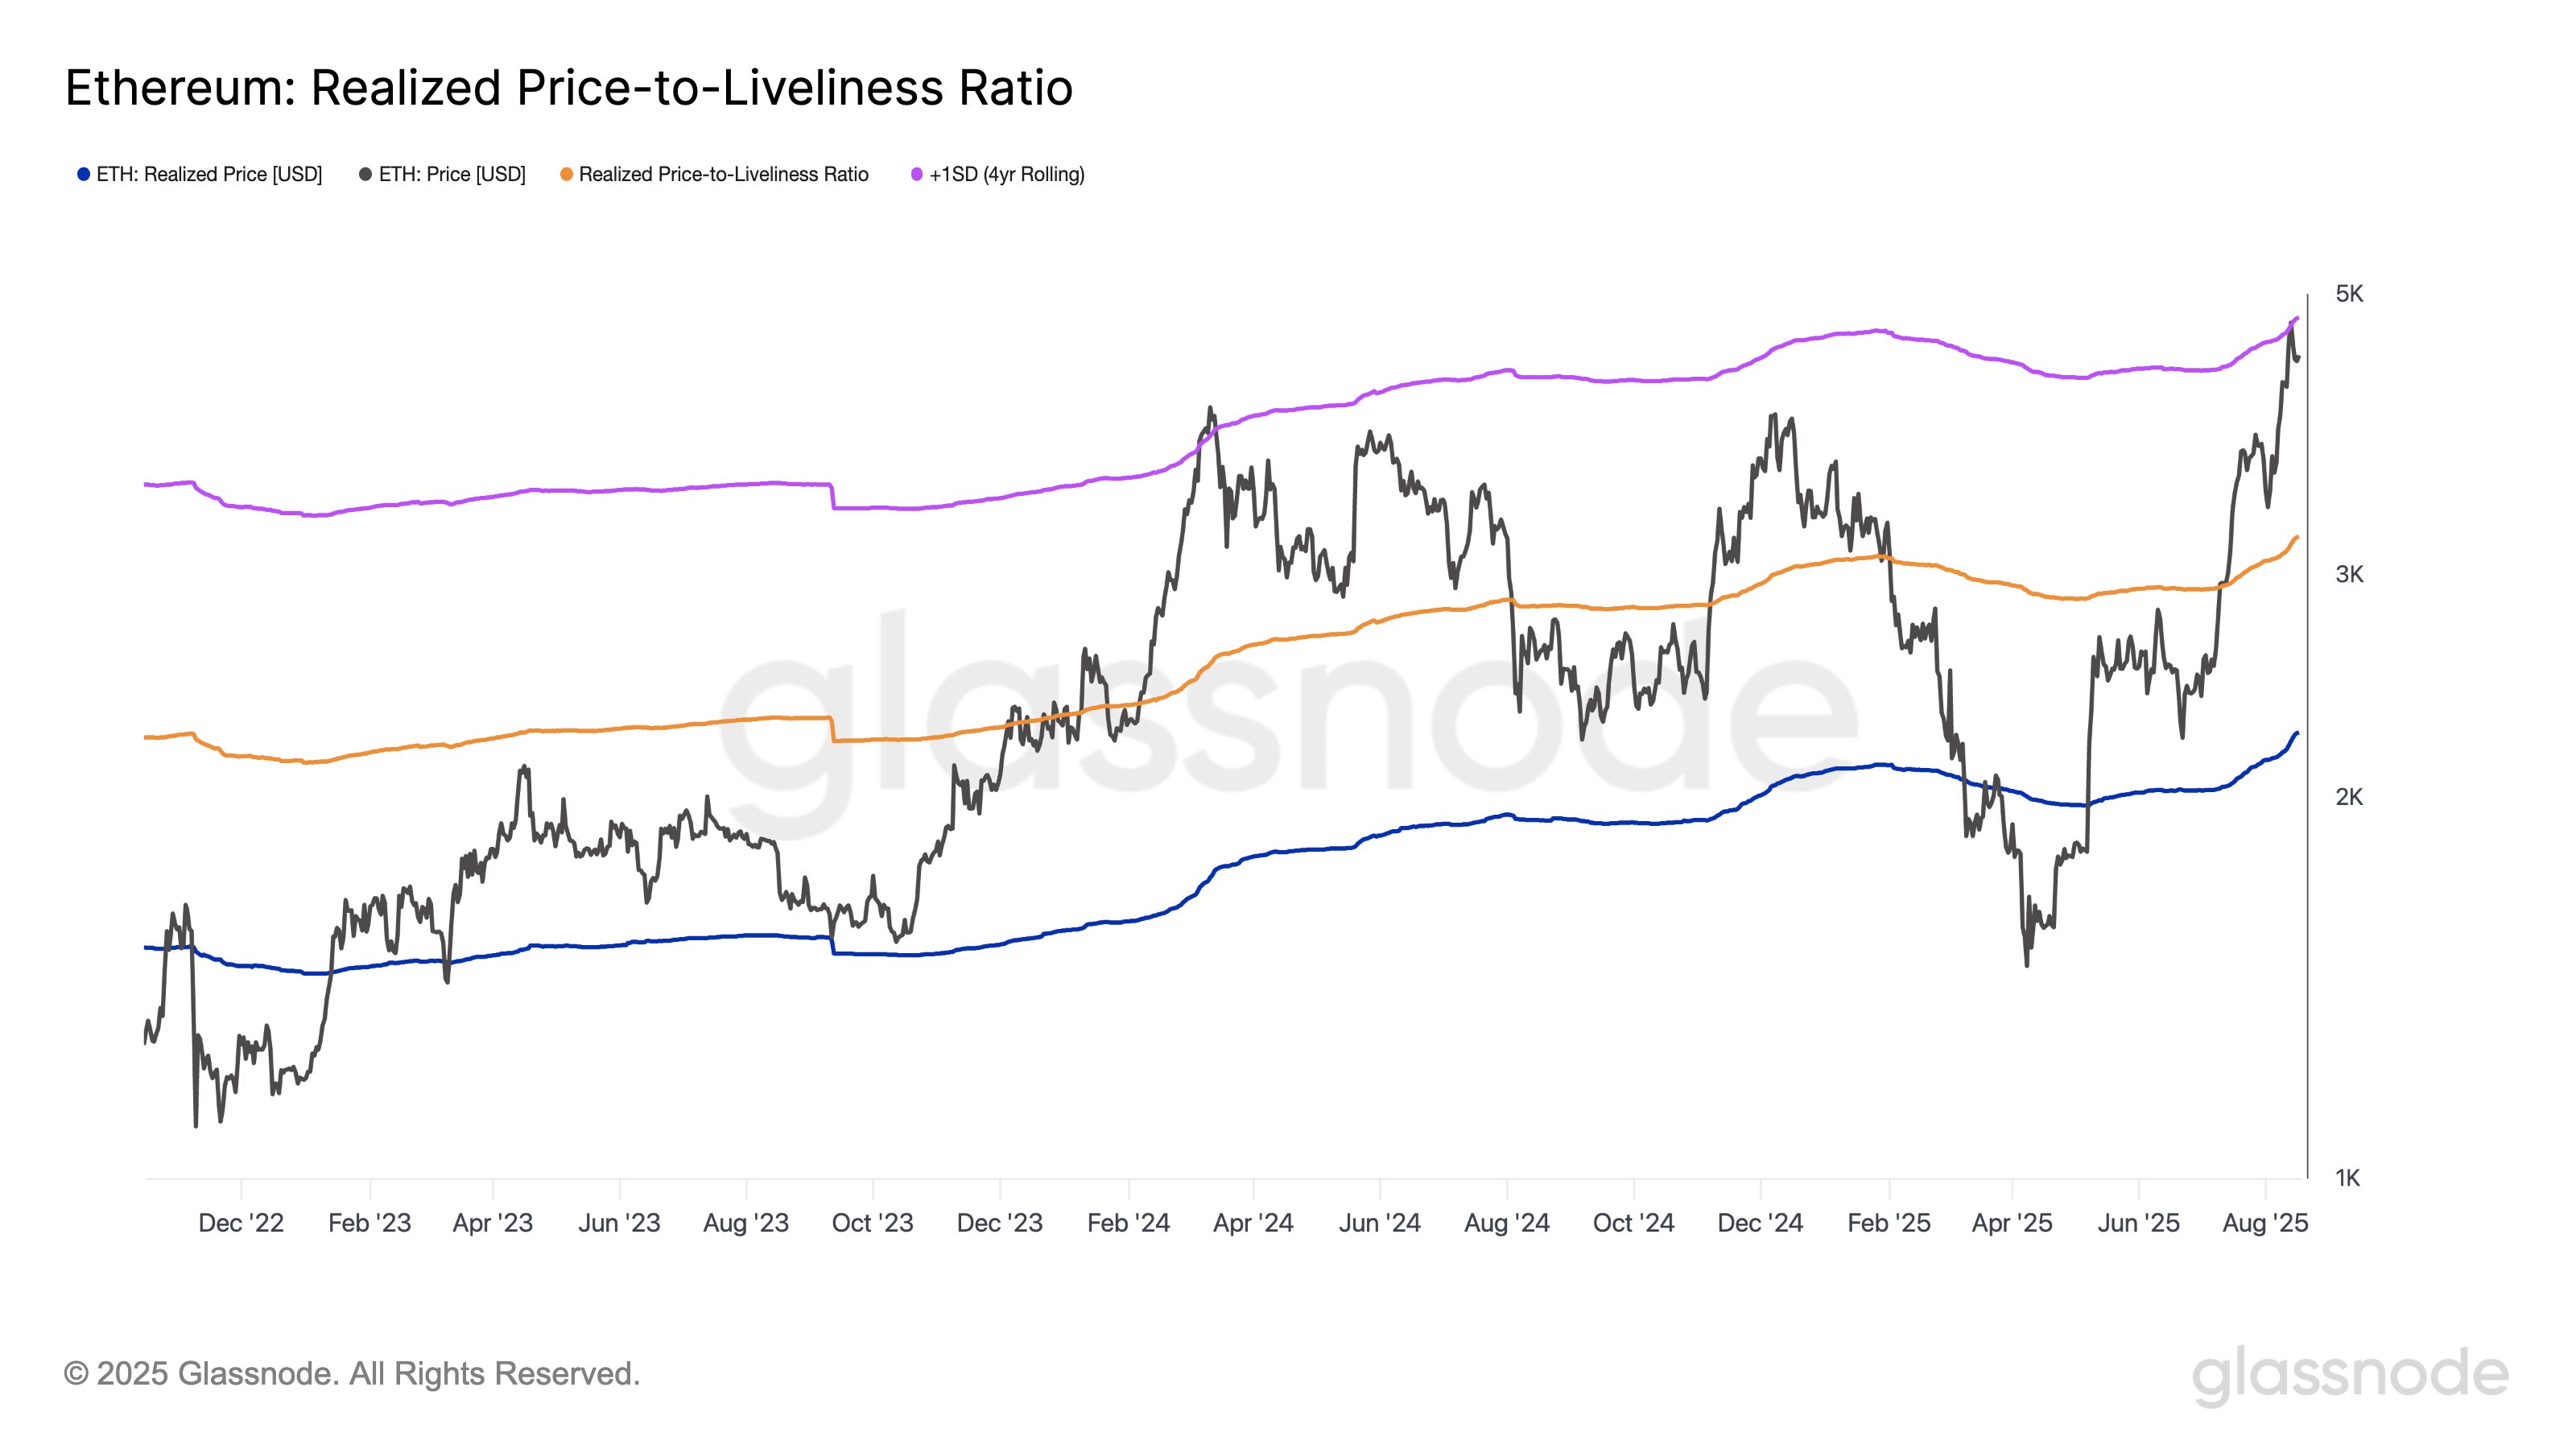
Ethereum Plunges 10% After Smashing Into This Historical Barrier
On-chain data shows Ethereum has once again found rejection at a level that has repeatedly acted as ...