XRP Price Correction Deepens After Failed Attempt to Hold Gains


XRP price is correcting gains from the $3.120 zone. The price is now trading below $3.00 and remains at risk of more losses in the near term.
- XRP price is showing bearish signs from the $3.120 resistance.
- The price is now trading below $2.950 and the 100-hourly Simple Moving Average.
- There was a break below a rising channel with support at $3.00 on the hourly chart of the XRP/USD pair (data source from Kraken).
- The pair could continue to down if it stays below the $3.00 zone.
XRP Price Dips Again
XRP price attempted more gains above the $3.050 zone but struggled, like Bitcoin and Ethereum . The price topped near the $3.120 level and recently started a downside correction.
There was a move below the $3.050 and $3.00 levels. The price dipped below the 76.4% Fib retracement level of the upward move from the $2.781 swing low to the $3.126 high. Besides, there was a break below a rising channel with support at $3.00 on the hourly chart of the XRP/USD pair.
Finally, the price tested the $2.820 zone. A low was formed at $2.8244 and the price is now consolidating losses. The price is now trading below $2.950 and the 100-hourly Simple Moving Average.
On the upside, the price might face resistance near the $2.90 level. The first major resistance is near the $2.980 level. It is close to the 50% Fib retracement level of the recent decline from the $3.126 swing high to the $2.824 low.
A clear move above the $2.980 resistance might send the price toward the $3.050 resistance. Any more gains might send the price toward the $3.120 resistance. The next major hurdle for the bulls might be near $3.20.
Another Decline?
If XRP fails to clear the $2.980 resistance zone, it could start a fresh decline. Initial support on the downside is near the $2.8250 level. The next major support is near the $2.780 level.
If there is a downside break and a close below the $2.780 level, the price might continue to decline toward $2.720. The next major support sits near the $2.650 zone, below which the price could gain bearish momentum.
Technical Indicators
Hourly MACD – The MACD for XRP/USD is now gaining pace in the bearish zone.
Hourly RSI (Relative Strength Index) – The RSI for XRP/USD is now below the 50 level.
Major Support Levels – $2.8250 and $2.780.
Major Resistance Levels – $2.980 and $3.050.

What’s Next For Bitcoin? Key Developments After Falling To $112,000
The market’s leading cryptocurrency, Bitcoin (BTC), has recently attempted to stabilize around $112,...
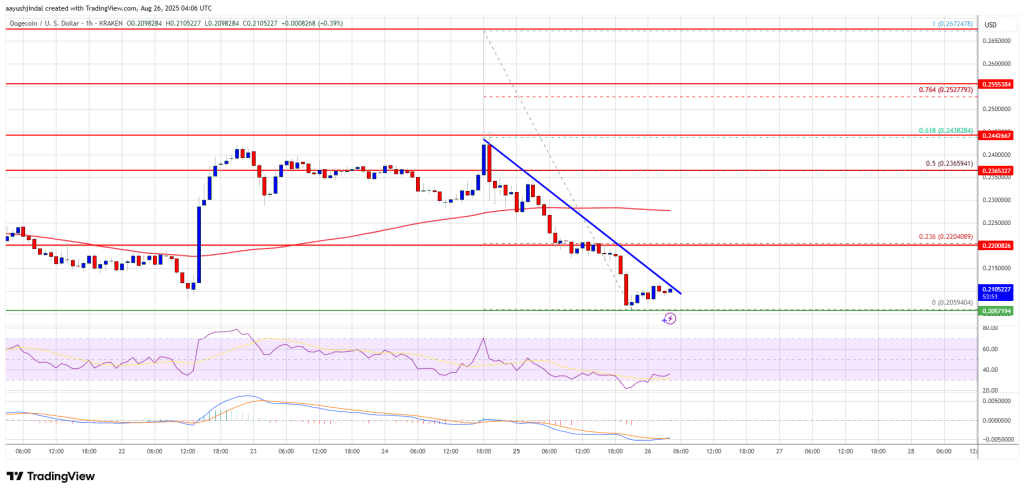
Dogecoin (DOGE) Bears Eye Breakdown Below $0.20 After Steep Correction
Dogecoin started a fresh decline below the $0.220 zone against the US Dollar. DOGE is now consolidat...

XRP at a Crossroads: Whale Activity Signals a Critical Price Test Ahead
XRP has struggled to maintain its momentum in recent weeks, with the token slipping nearly 10% over ...