Solana (SOL) Faces Heavy Resistance – Can Bulls Prevent a $200 Breakdown?


Solana started a fresh increase from the $194 zone. SOL price is now recovering higher and faces a heavy resistance near $212.
- SOL price started a recovery wave after it tested the $194 zone against the US Dollar.
- The price is now trading above $200 and the 100-hourly simple moving average.
- There was a break below a connecting bullish trend line with support at $207 on the hourly chart of the SOL/USD pair (data source from Kraken).
- The pair could start a fresh increase if it clears the $212 resistance zone.
Solana Price Faces Resistance
Solana price started a decent increase from the $194-$195 zone, like Bitcoin and Ethereum . SOL was able to climb above the $200 and $202 resistance levels.
There was a clear move above the 50% Fib retracement level of the downward move from the $218 swing high to the $194 low. However, the bears seem to be active near the $212 resistance zone. The price reacted to the downside below $210.
There was a break below a connecting bullish trend line with support at $207 on the hourly chart of the SOL/USD pair. Solana is now trading above $204 and the 100-hourly simple moving average.
On the upside, the price is facing resistance near the $2102 level. The next major resistance is near the $212 level or the 76.4% Fib retracement level of the downward move from the $218 swing high to the $194 low. The main resistance could be $218. A successful close above the $218 resistance zone could set the pace for another steady increase. The next key resistance is $232. Any more gains might send the price toward the $245 level.
Another Decline In SOL?
If SOL fails to rise above the $212 resistance, it could continue to move down. Initial support on the downside is near the $204 zone. The first major support is near the $200 level.
A break below the $200 level might send the price toward the $195 support zone. If there is a close below the $195 support, the price could decline toward the $184 support in the near term.
Technical Indicators
Hourly MACD – The MACD for SOL/USD is losing pace in the bullish zone.
Hourly Hours RSI (Relative Strength Index) – The RSI for SOL/USD is below the 50 level.
Major Support Levels – $200 and $195.
Major Resistance Levels – $212 and $218.
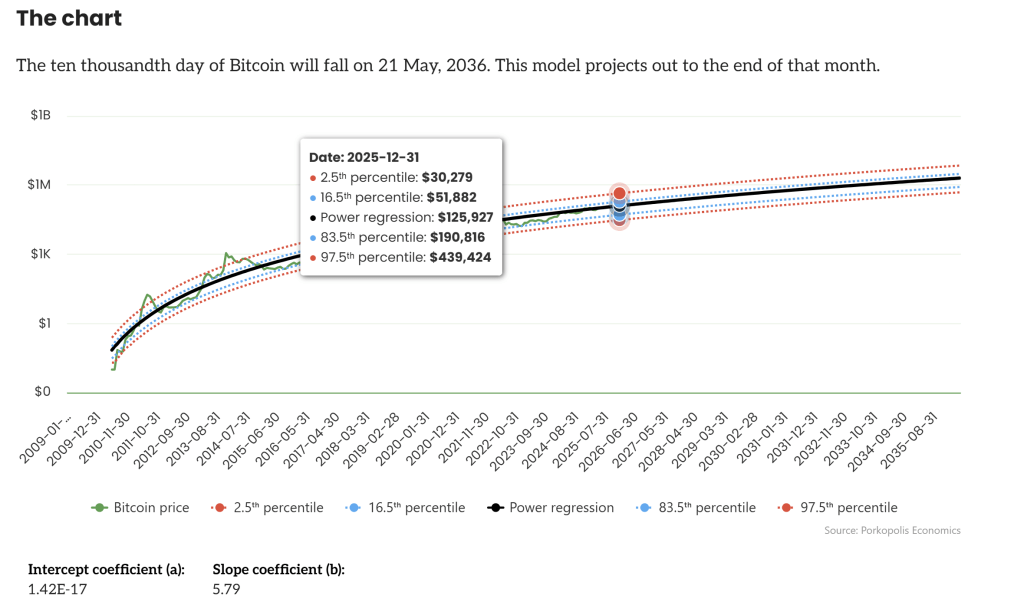
$375,000 Bitcoin? Market Veteran Says It’s Closer Than You Think
Matthew Mežinskis, the analyst behind Porkopolis Economics and co-host of the “crypto_voices” podcas...
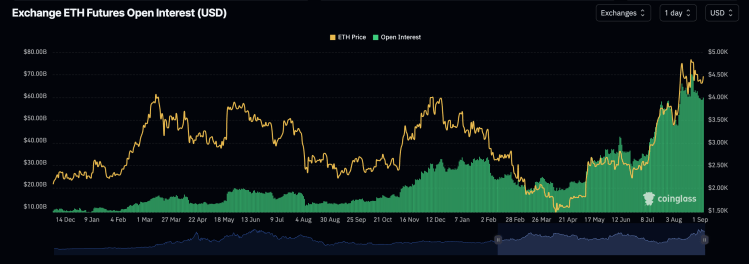
Bitcoin, Ethereum Open Interest Are Sitting Close To ATH Levels, What Happened Last Time?
Over the last few weeks, both Bitcoin and Ethereum have seen an interesting wave of price action wit...
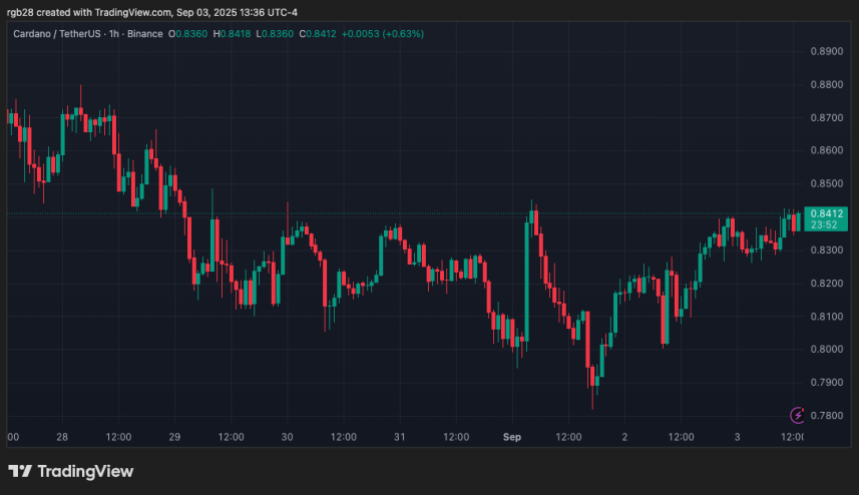
Cardano (ADA) Redemption Controversy Over? Hoskinson Shares IOG Audit Results
Following the controversial accusations, the results of the third-party forensic review of the Carda...