Bitcoin Price Struggles Again – Will Bears Push Price Into Deeper Decline Soon?


Bitcoin price extended losses after it traded below $113,800. BTC is now consolidating losses and might decline again to test the $110,500 support zone.
- Bitcoin started a fresh decline below the $113,500 zone.
- The price is trading below $113,500 and the 100 hourly Simple moving average.
- There is a bearish trend line forming with resistance at $114,000 on the hourly chart of the BTC/USD pair (data feed from Kraken).
- The pair might start another increase if it clears the $114,000 zone.
Bitcoin Price Stuck Below Resistance
Bitcoin price failed to start a recovery wave and stayed below $115,000. BTC declined below the $113,500 and $113,000 support levels to move further into a bearish zone.
The decline gained pace below the $112,500 level. A low was formed at $111,111 and the price is now consolidating losses. There was a minor move above the 23.6% Fib retracement level of the recent decline from the $117,920 swing high to the $111,111 low.
Bitcoin is now trading below $113,500 and the 100 hourly Simple moving average . Besides, there is a bearish trend line forming with resistance at $114,000 on the hourly chart of the BTC/USD pair.
Immediate resistance on the upside is near the $113,500 level. The first key resistance is near the $114,000 level and the trend line. The next resistance could be $114,500 or the 50% Fib retracement level of the recent decline from the $117,920 swing high to the $111,111 low.
A close above the $114,500 resistance might send the price further higher. In the stated case, the price could rise and test the $115,500 resistance. Any more gains might send the price toward the $116,500 level. The next barrier for the bulls could be $117,250.
Another Decline In BTC?
If Bitcoin fails to rise above the $114,000 resistance zone, it could start a fresh decline. Immediate support is near the $112,000 level. The first major support is near the $111,250 level.
The next support is now near the $110,500 zone. Any more losses might send the price toward the $108,800 support in the near term. The main support sits at $107,500, below which BTC might gain bearish momentum.
Technical indicators:
Hourly MACD – The MACD is now gaining pace in the bearish zone.
Hourly RSI (Relative Strength Index) – The RSI for BTC/USD is now below the 50 level.
Major Support Levels – $112,000, followed by $111,250.
Major Resistance Levels – $113,500 and $114,000.
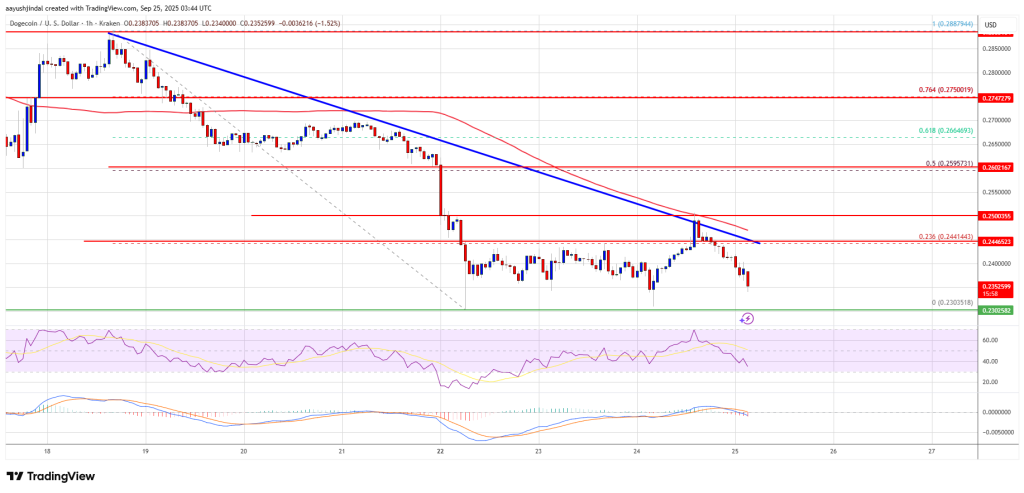
Dogecoin (DOGE) Struggles Again – Is Market Preparing For Another Sharp Drop?
Dogecoin started a fresh decline below the $0.250 zone against the US Dollar. DOGE is now consolidat...

Stellar (XLM) Shows Signs of Strength: Analysts See $0.5 Target in Play
Stellar (XLM) is showing signs of resilience after weeks of consolidation, with the cryptocurrency d...
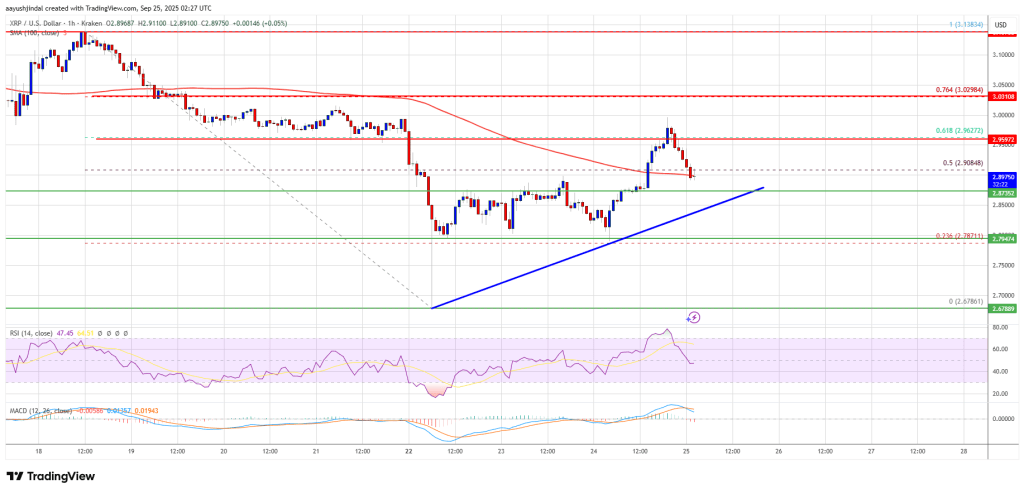
XRP Price Recovery Stalls – Traders Watching If Bulls Can Overcome Resistance
XRP price attempted a recovery wave above the $2.850 zone. The price is now struggling to clear $3.0...