Bitcoin Price Stabilizes — Buyers Step In To Prevent Deeper Correction


Bitcoin price is attempting to recover above $108,500 and $108,800. BTC could rise further if there is a clear move above the $111,200 resistance.
- Bitcoin started a fresh recovery wave above the $108,800 resistance level.
- The price is trading above $109,000 and the 100 hourly Simple moving average.
- There was a break above a short-term channel with resistance at $108,700 on the hourly chart of the BTC/USD pair (data feed from Kraken).
- The pair might continue to move up if it trades above the $111,200 zone.
Bitcoin Price Starts Fresh Increase
Bitcoin price declined again below the $109,000 level. BTC tested the $106,720 zone and is currently attempting a fresh increase. There was a move above the $108,000 and $108,800 resistance levels.
The price climbed above the 50% Fib retracement level of the downward move from the $114,000 swing high to the $106,717 low. Besides, there was a break above a short-term channel with resistance at $108,700 on the hourly chart of the BTC/USD pair.
Bitcoin is now trading above $109,000 and the 100 hourly Simple moving average. Immediate resistance on the upside is near the $111,200 level or the 61.8% Fib retracement level of the downward move from the $114,000 swing high to the $106,717 low.
The first key resistance is near the $111,500 level. The next resistance could be $112,500. A close above the $112,500 resistance might send the price further higher. In the stated case, the price could rise and test the $113,200 resistance. Any more gains might send the price toward the $114,000 level. The next barrier for the bulls could be $115,500.
Another Drop In BTC?
If Bitcoin fails to rise above the $111,200 resistance zone, it could start a fresh decline. Immediate support is near the $109,500 level. The first major support is near the $108,800 level.
The next support is now near the $108,500 zone. Any more losses might send the price toward the $107,400 support in the near term. The main support sits at $106,500, below which BTC might struggle to recover in the short term.
Technical indicators:
Hourly MACD – The MACD is now gaining pace in the bullish zone.
Hourly RSI (Relative Strength Index) – The RSI for BTC/USD is now above the 50 level.
Major Support Levels – $109,500, followed by $108,800.
Major Resistance Levels – $111,200 and $112,500.

‘Unthinkable Scenario’ Required For Bitcoin To Hit $250K, CEO Says
Mike Novogratz, CEO of Galaxy Digital, warned that Bitcoin reaching $250,000 by year-end would take ...
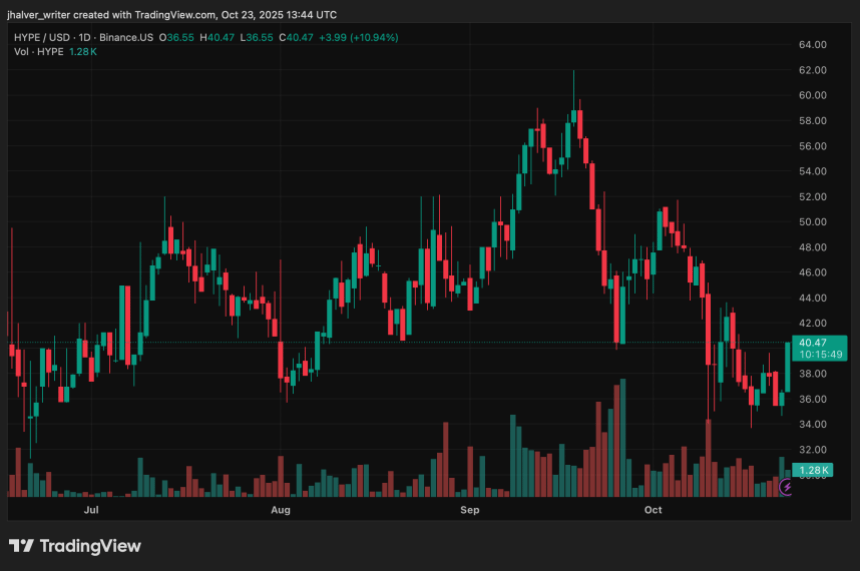
Hyperliquid Price Breaks Key Resistance as $1B Fundraising and IPO Plans Gain Traction
HYPE has reignited bullish sentiment across the crypto market after a sharp 11.91% daily surge pushe...
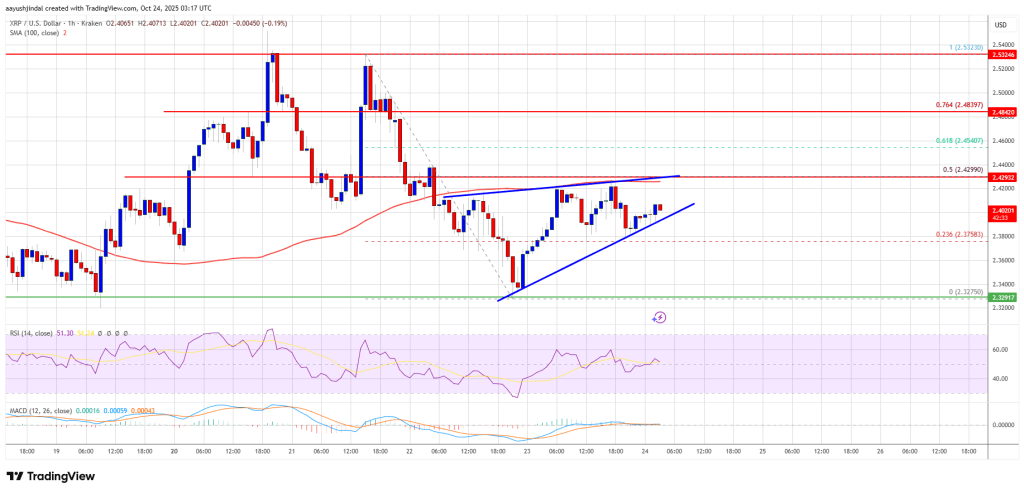
XRP Price Stuck In Range As Bulls Struggle To Clear Key Resistance
XRP price started a recovery wave from $2.320. The price is now struggling to clear $2.420 and might...