XRP Price Prediction: Stable Action Hints At Brewing Bullish Breakout


XRP price started a fresh increase above $2.550. The price is now facing hurdles above $2.650 and at risk of another decline in the near term.
- XRP price failed to continue higher above $2.70 and corrected some gains.
- The price is now trading below $2.60 and the 100-hourly Simple Moving Average.
- There is a bearish trend line forming with resistance at $2.65 on the hourly chart of the XRP/USD pair (data source from Kraken).
- The pair could start a fresh increase if it stays above $2.5120.
XRP Price Holds Support
XRP price formed a short-term top near $2.69 and started a downside correction, like Bitcoin and Ethereum . The price dipped below the $2.65 and $2.62 levels.
There was a move below the 23.6% Fib retracement level of the upward wave from the $2.327 swing low to the $2.697 high. The price even spiked below $2.55 but remained stable above $2.50. Besides, there is a bearish trend line forming with resistance at $2.65 on the hourly chart of the XRP/USD pair.
The price is now trading below $2.60 and the 100-hourly Simple Moving Average. If there is a fresh upward move, the price might face resistance near the $2.620 level. The first major resistance is near the $2.650 level and the trend line, above which the price could rise and test $2.680.
A clear move above the $2.680 resistance might send the price toward the $2.720 resistance. Any more gains might send the price toward the $2.750 resistance. The next major hurdle for the bulls might be near $2.80.
More Losses?
If XRP fails to clear the $2.650 resistance zone, it could start a fresh decline. Initial support on the downside is near the $2.550 level. The next major support is near the $2.5120 level and the 50% Fib retracement level of the upward wave from the $2.327 swing low to the $2.697 high.
If there is a downside break and a close below the $2.5120 level, the price might continue to decline toward $2.468. The next major support sits near the $2.420 zone, below which the price could continue lower toward $2.40.
Technical Indicators
Hourly MACD – The MACD for XRP/USD is now losing pace in the bearish zone.
Hourly RSI (Relative Strength Index) – The RSI for XRP/USD is now below the 50 level.
Major Support Levels – $2.550 and $2.5120.
Major Resistance Levels – $2.620 and $2.650.
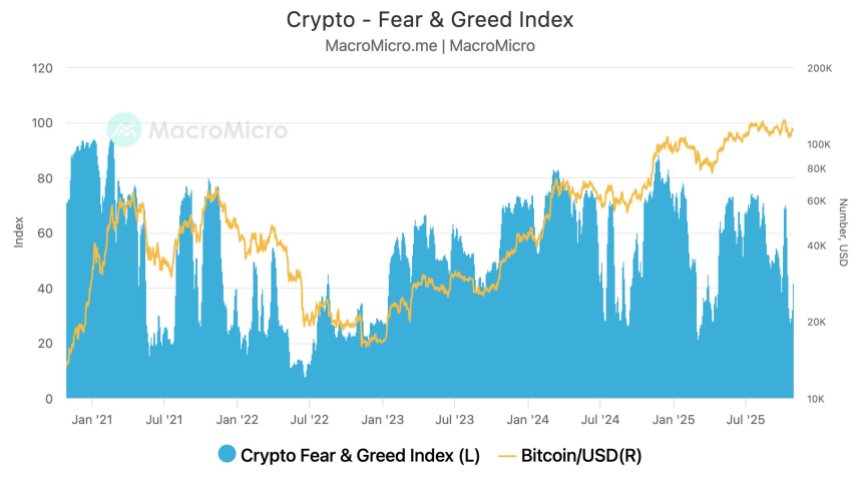
Bitcoin Price Path Ahead: 10 Indicators Converge For Market Surge, End-Of-2025 Projections
Despite recent interest rate cuts by the Federal Reserve on Wednesday, Bitcoin’s price reacted unexp...
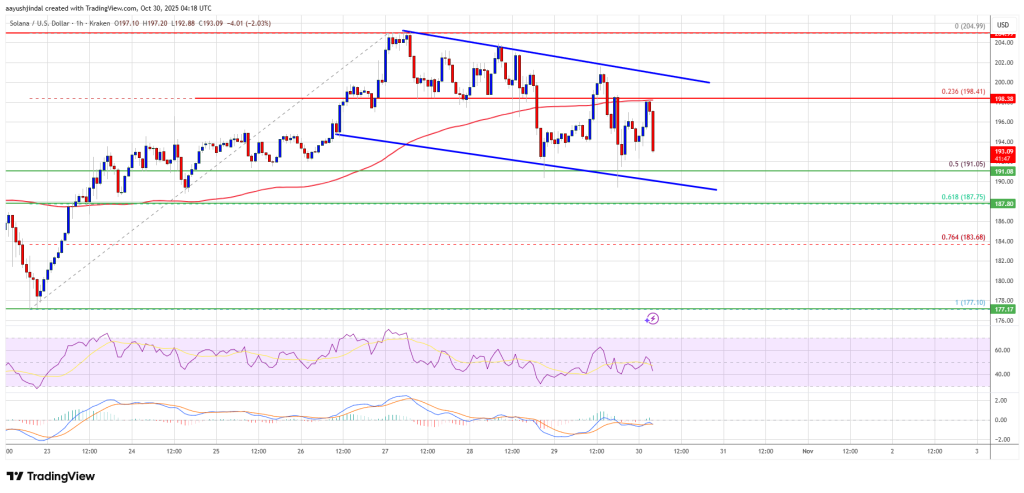
Solana (SOL) Drops Toward Support — Bulls Eye Potential Recovery Base
Solana failed to stay above $198 and corrected gains. SOL price is now trading below $195 and might ...
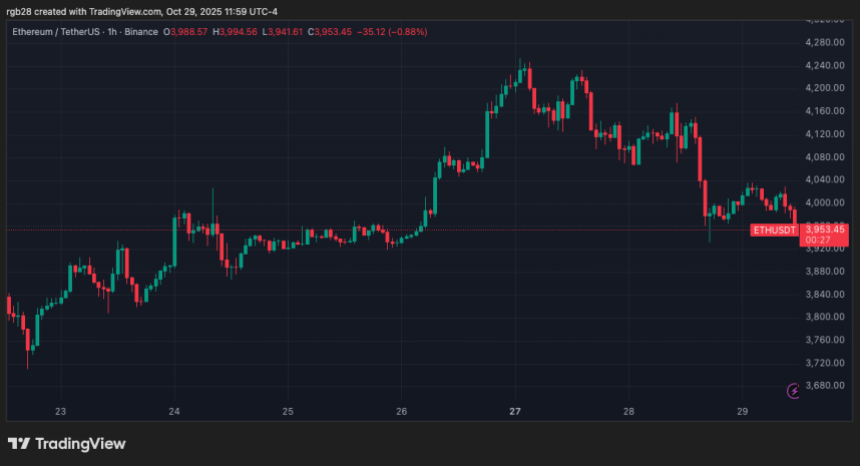
Ethereum (ETH) Prepares For ‘Last Euphoric Run’ As Whales Go On $135M Buying Spree
As the market awaits the Federal Open Market Committee (FOMC) meeting, Ethereum (ETH) is attempting ...