
The post Chainlink (LINK) Price Analysis Today – October 31, 2025: LINK Drops Below $17, Can Bulls Regain Control? appeared first on Coinpedia Fintech News
As of October 31, 2025, Chainlink (LINK) is trading near $17.05, down around 2.8% in the last 24 hours. The decline comes as broader crypto market momentum cools, with Bitcoin struggling to hold above $110,000.
Despite this pullback, LINK remains one of the top-performing altcoins over the past quarter, posting a 30% gain in Q3 2025 due to steady growth in Chainlink’s oracle adoption and integrations across DeFi protocols.
Chainlink Active Addresses
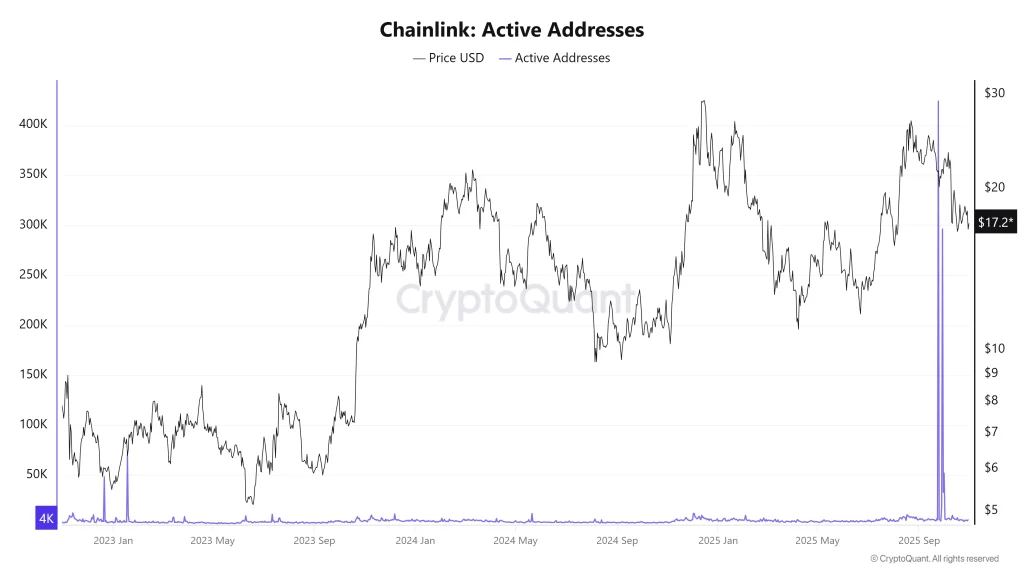
As per CryptoQuant , Recent on-chain data shows that whale transactions have slowed compared to last week, signaling reduced accumulation. However, the total number of active addresses remains stable, reflecting consistent user engagement within the Chainlink ecosystem.
Additionally, traders are closely watching Bitcoin’s next move, as LINK tends to mirror BTC’s short-term price action. A BTC rebound above $112,000 could help stabilize LINK above $17 once again
LINK Price Analysis
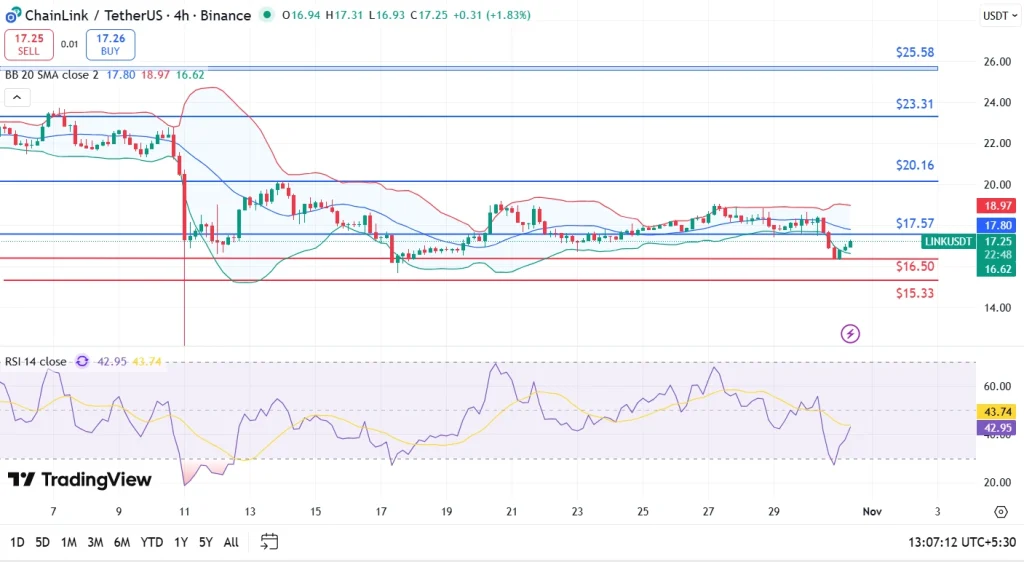
On the daily chart , LINK has broken below its ascending support line near $17.50 , turning it into immediate resistance. The next major support lies around $16.5 , followed by $15.8.
- Resistance Levels: $17.50 and $18.20
- Support Levels: $16.50 and $15.80
- RSI (14): 43 — indicating mild bearish pressure
- MACD: Showing a weak bearish crossover
Chainlink (LINK) Outlook for November
Looking ahead, the $16.5 support zone will likely determine LINK’s next direction. A successful defense could attract new buyers and push the price back above $18, while failure to hold may lead to a test of $15.5.
With Chainlink’s continued partnerships in real-world data tokenization and oracle expansion, long-term sentiment remains bullish , even if the short-term trend appears slightly bearish .
FAQs
Chainlink price fell due to heavy institutional selling, loss of key technical support, and overall risk-off sentiment driven by Bitcoin’s correction.
Current support levels are at $16.50 and $15.33, while resistance stands at $17.20.
Spikes in active addresses signal rising on-chain activity and volatility, which could precede either a rebound or deeper decline, depending on how traders react to new momentum.