


Ethereum has spent much of December under pressure, and the r ecent fall below $3,000 has left a visible mark on investor positioning.
On-chain data now shows a notable deterioration in profitability across the network, with the share of ETH supply sitting in profit falling below 60%. At the same time, institutional demand has decreased , with data from Glassnode showing how both retail profitability and institutional participation in Ethereum have weakened simultaneously.
Ethereum’s Percent Supply In Profit Falls Below 60%
The drop in Ethereum’s percent supply in profit has been one of the clearest signals of stress for Ethereum. Ethereum’s investors have fallen into deeper losses, and this is a reflection of recent price action.
Speaking of price action, Ethereum had initially reclaimed the $3,000 price level on December 22. During this time, the percentage of ETH supply in profit pushed back above 60% and reached as high as 63%. However, this break was for only a very brief time, and price action fell back below $3,000 after just a few hours.
As ETH broke below $3,000 again, the share of supply held at unrealized gains fell under 60%, down from above 70% earlier in December. This fall shows that the pullback has not been limited to recent buyers but has begun to impact investors who accumulated during the beginning of the month.

ETH Percent Supply In Profit. Source: Glassnode
ETF Net Outflows Indicate Waning Institutional Participation
The weakness in on-chain profitability and price action is also a reflection of trends in the ETF market. Another data metric from Glassnode shows that since early November, the 30-day moving average of net flows into US Spot Ethereum ETFs has turned negative and remained there. This persistence of outflows points to a phase of muted participation and disengagement from institutional traders.

The ETF chart below shows that inflows, which supported Ethereum’s push to new all-time highs in August, have faded, replaced by continued outflows through November and December. This matters for price action because ETF demand has been a key source of incremental buying. As that bid has weakened, Ethereum has struggled to absorb sell-side pressure, contributing to its failure to hold above $3,000.
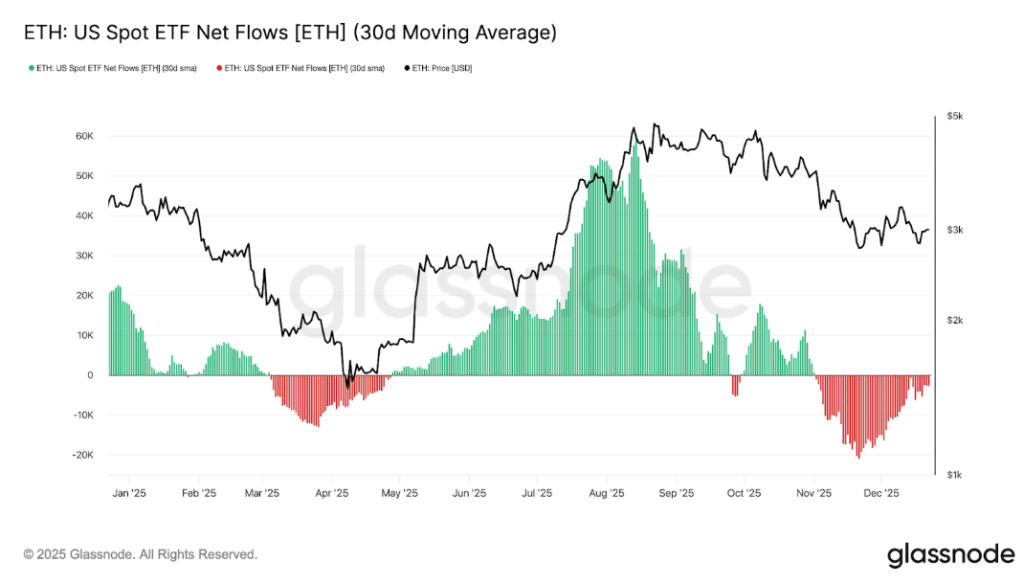
ETH: US Spot ETF Net Flows. Source: Glassnode
The combination of negative ETF net flows and Ethereum’s recent price behaviorhelps explain rising unrealized losses. Interestingly, various on-chain data sources also reveal different instances of whale addresses reducing their exposure to Ethereum outside of spot ETFs.
For instance, Lookonchain recently highlighted activity from a wallet believed to be linked to Erik Voorhees, which swapped 4,619 ETH, valued at about $13.42 million, into Bitcoin Cash (BCH) over the past two weeks after having been inactive for nearly nine years. Voorhees later responded by clarifying that the wallet does not belong to him and that he does not hold any Bitcoin Cash.
Lookonchain also pointed to selling pressure from Arthur Hayes, co-founder of BitMEX, who has offloaded a total of 1,871 ETH at about $5.53 million in the past week.
Featured image from Unsplash, chart from TradingView


