The US military's capture of an Iranian cargo ship escalated tensions over a possible truce, weighing on global markets.
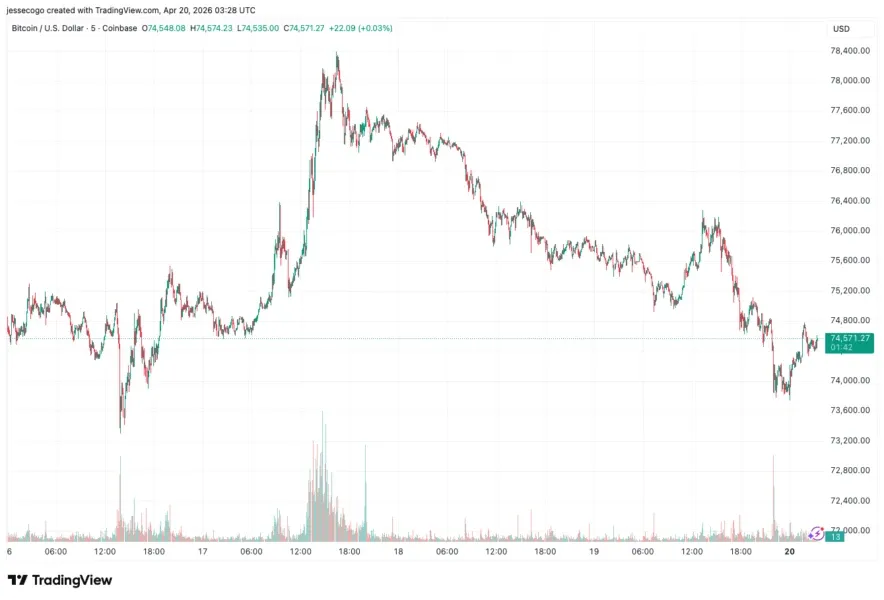
Bitcoin's value is picking up slightly after it retreated from its weekend highs to below $74,000 on Sunday. Global markets took a hit after a solid rally to record highs last week. The top token climbed above $78,300 on Friday, reaching its highest point since early February.
However, after Iran's announcement to block the vital oil route in the Strait of Hormuz, the price fell through the weekend, settling between $75,000 and $76,000.
Geopolitics at it Again
The US Navy reported that it engaged and detained an Iranian cargo vessel suspected of attempting to bypass its blockade of Iranian ports, while Tehran claimed that the US violated a previously established truce.
Consequently, Bitcoin experienced a significant decline late on Sunday, briefly trading under $74,000.
On Wednesday, the two-week truce between the US and Iran will come to an end, a development that has had a positive impact on markets and helped stabilise oil prices.
Iranian state media reports that Tehran plans to react to the US military's seizure of the ship and has brushed off Monday's peace talks in Islamabad, Pakistan, blaming them on the US embargo.
As news of naval combat and the failure of diplomatic attempts spread, financial markets saw a broader decline in sentiment.
On Sunday night, as tensions rose, US market futures fell. The S&P 500 futures fell 0.8%, the Nasdaq-100 futures fell 0.6%, and the Dow Jones futures fell 0.9%, meaning over 450 points.
Investors pulled their money out of riskier assets on the prospect of a protracted interruption in Middle Eastern energy supplies, which caused a substantial reaction in energy prices.
The Strait of Hormuz is a vital passageway for a large amount of the world's oil, and the recent escalation of tensions and Iran's threats to block it have caused worldwide market benchmarks to jump.
The continuing tensions and Iran's warning about the possible closing of the Strait of Hormuz caused oil prices to soar significantly, with crude oil futures surging more than 4.5 percent to over $95 per barrel.
With a two-point uptick to 29 out of 100 on Monday, the Crypto Fear & Greed index reached its highest level since late January, but still displayed a feeling of "fear."
Investors are considering the possibility of more escalation before the truce formally ends mid-week. The measure is stuck in the "fear" area, even if this is the greatest level of confidence recorded since late January.
The fact that the price of bitcoin has risen beyond $74,000 indicates that there is still a lot of demand from buyers at lower levels, which may avert a complete crash in the near future.
Instead of seeing the decline for what it really is—a short-term reaction to headline risk—it seems like a lot of traders are dismissing it as a long-term trend reversal.
Bitcoin Moves & Bets
According to TradingView, the $72,000 support level is the centre of attention; a clear breakdown below this level would trigger a more substantial decline below the $68,000 zone.
At periods of heightened volatility, this psychological level has historically served as a pivotal market turning point. On the other side, a possible future thawing of hostilities between the two nations is likely to be the deciding factor in any sustained upward trend.
It may be difficult for the asset to hit the $78,000 high reached earlier in the weekend if the targeted diplomatic routes remain blocked and oil prices continue to rise.
Since late last week, the price of Bitcoin has been unable to maintain its position above the $77,500 resistance level. BTC reached a peak around $78,350 and has since begun a new downward trend.
It fell beneath another support of the $76,500 mark. The $75,500 and $75,000 marks were both broken. Now, the price is settling just below the 23.6% Fibonacci retracement level of the fall from the $78,343 high to the $73,637 low, having hit a low of $73,637.
With a price of $76,000, Bitcoin has fallen below the 100-hour simple moving average. If the price remains stable over $73,500, a fresh upward trend would be possible. At around $74,750, we see the present degree of resistance.
Around the $75,500 threshold is where the first major resistance is. TradingView analysis showed that on the hourly chart of the BTC/USD pair, a negative trend line is starting to form, which would act as resistance at $75,600.
The price might reach new heights if it breaks out above the $75,500 barrier line.
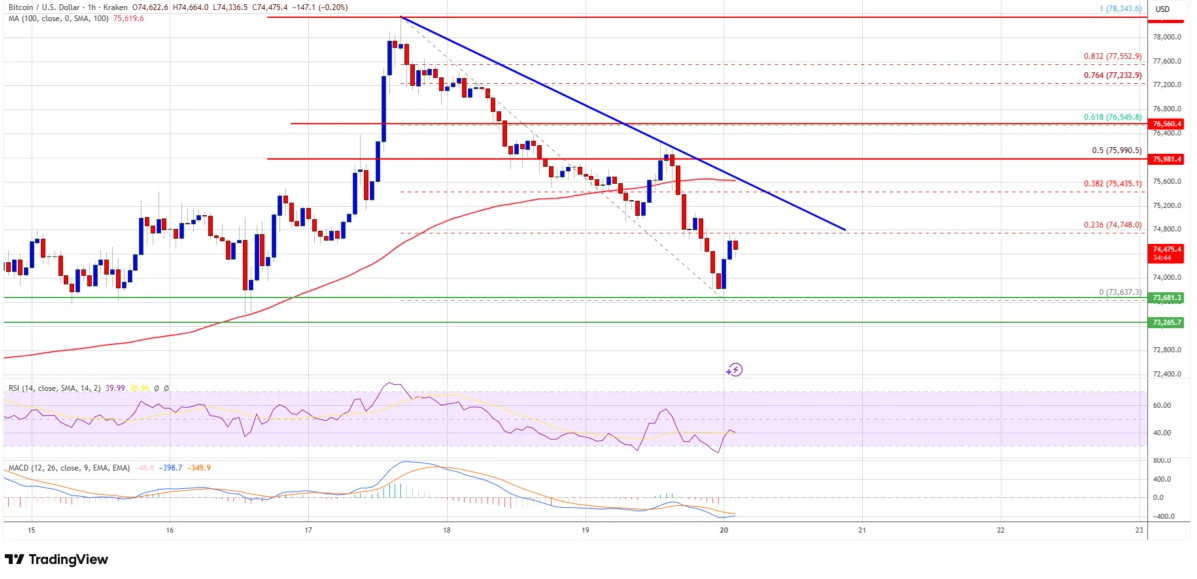
If this plays out, we might see prices rise to the $76,000 resistance level and then retrace half of the loss from the $78,343 high to the $73,637 low.
If prices continue to rise, they may reach $77,200, and the bulls may face a challenge of $78,000 in the near future.
There could be another downturn for Bitcoin if it does not surpass the $75,500 resistance threshold. At approximately the $74,000 mark, TradingView observes a strong level of support.
At approximately $73,500, the token will begin to show a strong level of support. The $72,500 range is viewed as the upcoming support level.
In the coming days, we may see the price decline to the $71,200 support level if additional downturns take place. If Bitcoin falls below the significant support level currently around $70,000, it could struggle to achieve a short-term recovery.
Crypto Market & Changing Geopolitical Dynamics
The present slump in the crypto market is mainly caused by the rising geopolitical tensions between Iran and the US. As both sides claimed to have reached an agreement to reopen the Strait of Hormuz on Friday, Bitcoin and a number of other altcoins saw a big boost.
As far as Iran was concerned, Trump's statement contained several major errors, most notably on the continuing embargo on Iranian ports. Since Iran had already announced the closing of the Strait, several ships had to change their routes.
At the same time, the United States announced that it had captured an Iranian warship, which cast doubt on the progress of the peace talks.
Israel has a vested interest in avoiding a resumption of hostilities between the United States and Iran. Crude oil prices and market volatility are both expected to rise as a consequence of this move.
Well-Timed Bets or Market Manipulation?
Concerns about possible manipulation inside the crypto business are also the main reason for the recent market slump.
These worries have been heightened by the recent SURGE and fall of RaveDAO, a cryptocurrency that rose to prominence in the sector very quickly.
With a fully diluted worth of $24 billion, the price surged from less than $1 at the start of the month to a high of $28.
Following a cautionary note from well-known online researcher ZachXBT regarding potential insider market manipulation, RaveDAO dropped to below $1 over the weekend.
He discovered several dubious addresses on well-known cryptocurrency platforms like Binance and Bitget.
A summary of the RAVE -95% price fluctuation from $26 to $1 over the past 24 hours.
— ZachXBT (@zachxbt) April 19, 2026
RAVE Timeline: April 18, 2026
7:26 am UTC: I posted a call to action for Binance, Bitget, & Gate to investigate RAVE market manipulation and offered a $10K bounty.
10:56 am UTC: I posted an… pic.twitter.com/mivKcdyBrw
He also cautioned that several well-known cryptocurrencies were exhibiting comparable patterns. River, MemeCore, Pippin, and Siren were all assets that were part of this collection.
In light of limited trading activity and clear interest, certain tokens have unexpectedly surfaced and are experiencing notable growth.
Given the recent uptick in hacking attacks, the crypto market is experiencing a period of high activity. According to new information from DeFiLlama, security breaches in the DeFi industry hit a new high this month, surpassing $600 million.
This is the biggest sum seen since February of last year.
Leading company Kelp had almost $296 million stolen in a major hack that happened over the weekend. Although nobody knows for sure who is responsible, several analysts have pointed fingers at the North Korean hacker group the Lazarus Group. Stakeholders liquidated almost $5 billion from Aave, the biggest bitcoin lending platform, after the hack caused a wave of panic selling. After dropping from over $49 billion, the total value locked (TVL) is now only $18 billion.
This is a very big loss. Since the depleted rsETH was collateral on the platform, Aave is vulnerable to the latest attack, which might cause financial difficulties.
In addition, Bitcoin has formed a bearish flag pattern on the three-day chart, which is contributing to the cryptocurrency market's fall. This has investors worried that the recent spike was just a trap.
What Do Other Technical Readings Show?
TradingView's overall technical summary for the week ahead, based on key data from moving averages, oscillators, and pivots, showed a neutral signal from a sell at the start of last week.
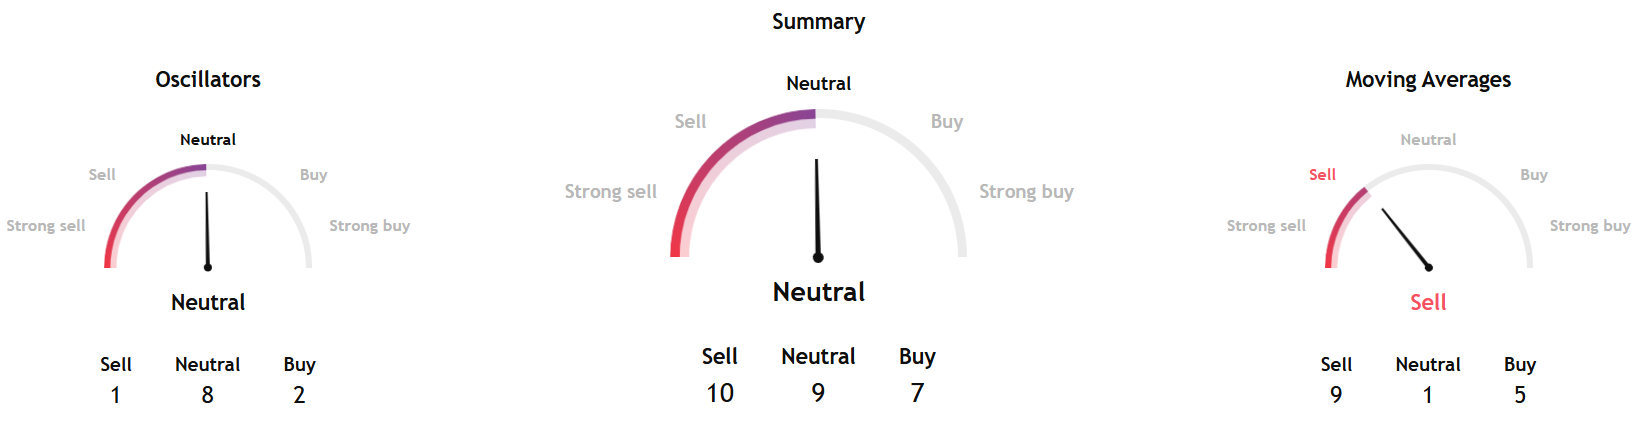
The sub measures under moving averages still showed a sell signal.
Separately, InvestTech's Algorithmic Overall Analysis and their one-to six-week recommendation showed a positive score.
The research said, "Investors have paid higher prices over time to buy Bitcoin, and the token is in a rising trend channel in the short term. Rising trends indicate that the token experiences positive development and that buy interest among investors is increasing."
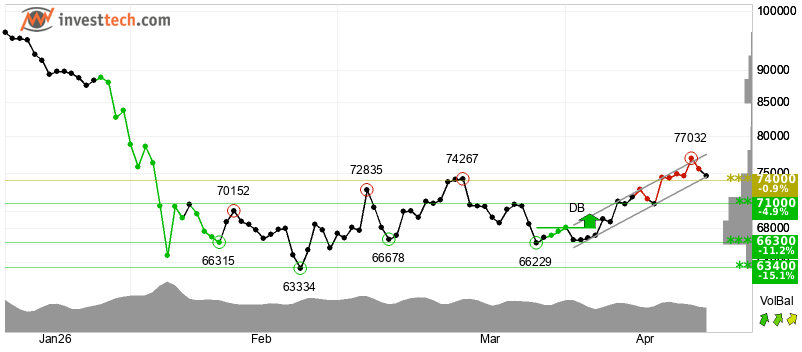
InvestTech added, "The token is testing support at $74,000. This could give a positive reaction, but a downward breakthrough of $74,000 means a negative signal. Volume tops and volume bottoms correspond well with tops and bottoms in the price. This strengthens the trend. The RSI curve shows a rising trend, which supports the positive trend. The token is overall assessed as technically positive for the short term."
If SoSoValue Data is anything to go by, for the third week in a row, U.S. spot bitcoin (BTC) exchange-traded funds have registered their highest weekly net inflows since mid-January.
The net inflow of $275.8 million into Ethereum ETFs last week was the most it has been since January 16.
The $996.4 million inflow that spot Bitcoin ETFs saw last week was the largest weekly sum since the week that ended on January 16. More than $1.8 billion has been invested in the funds in the past three weeks.
The biggest bitcoin fund by net assets, BlackRock's IBIT, attracted $906 million in investments over the week, driving the top inflows.
In addition, last week was the first full trading week for Morgan Stanley's MSBT, which made its debut on April 8. A net inflow of $71 million was registered by MSBT during the week.