Solana (SOL) Sees Red—What’s Next for the Price?


Solana started a fresh decline from the $162 zone. SOL price is down over 15% and might struggle to recover above the $150 resistance.
- SOL price started a fresh decline below the $162 and $150 levels against the US Dollar.
- The price is now trading below $150 and the 100-hourly simple moving average.
- There is a connecting bearish trend line forming with resistance at $144 on the hourly chart of the SOL/USD pair (data source from Kraken).
- The pair could start a fresh increase if the bulls clear the $150 zone.
Solana Price Dips Sharply
Solana price struggled to clear the $185 resistance and started a fresh decline, underperforming Bitcoin and Ethereum . SOL declined below the $162 and $150 support levels.
It even dived below the $135 level. The recent low was formed at $131 and the price is now consolidating losses with a bearish angle. There was a minor recovery wave above the 23.6% Fib retracement level of the downward move from the $173 swing high to the $131 swing low.
Solana is now trading below $145 and the 100-hourly simple moving average. On the upside, the price is facing resistance near the $144 level. There is also a connecting bearish trend line forming with resistance at $144 on the hourly chart of the SOL/USD pair.
The next major resistance is near the $150 level. The main resistance could be $152 and the 50% Fib retracement level of the downward move from the $173 swing high to the $131 swing low.
A successful close above the $152 resistance zone could set the pace for another steady increase. The next key resistance is $160. Any more gains might send the price toward the $165 level.
Another Decline in SOL?
If SOL fails to rise above the $145 resistance, it could start another decline. Initial support on the downside is near the $141 zone. The first major support is near the $136 level.
A break below the $136 level might send the price toward the $131 zone. If there is a close below the $125 support, the price could decline toward the $120 support in the near term.
Technical Indicators
Hourly MACD – The MACD for SOL/USD is losing pace in the bearish zone.
Hourly Hours RSI (Relative Strength Index) – The RSI for SOL/USD is below the 50 level.
Major Support Levels – $136 and $131.
Major Resistance Levels – $145 and $152.

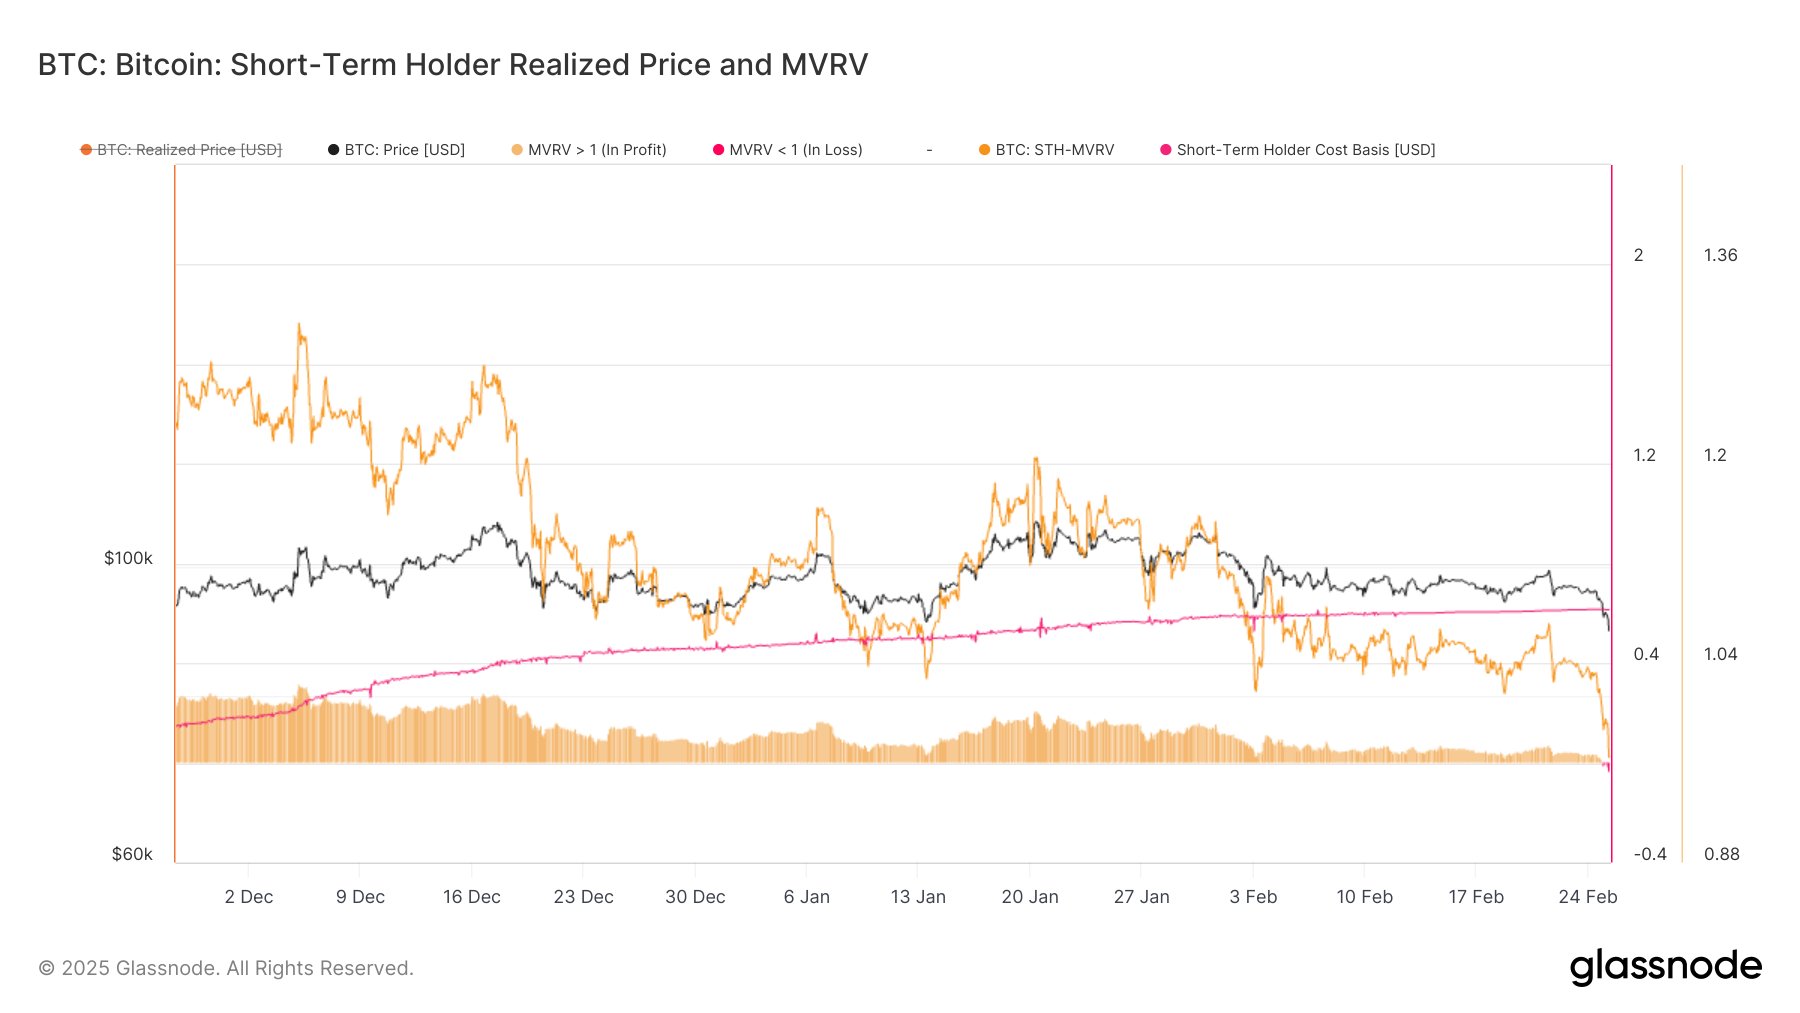
Bitcoin Headed For $72,000? These Metrics Could Hint So https://www.newsbtc.com/bitcoin-news/bitcoin-headed-72000-these-metrics-could-hint/
Bitcoin has seen a crash to the $87,000 level in the past day, but if on-chain data is to go by, the...

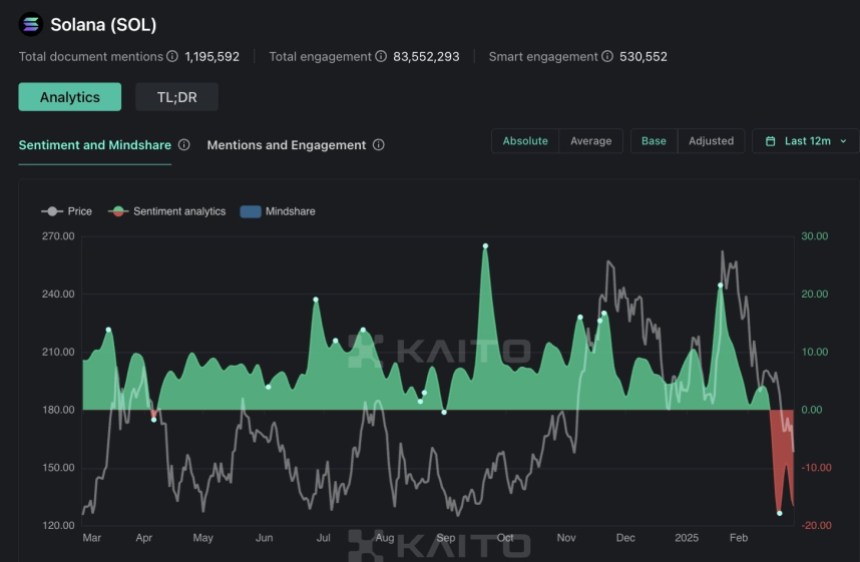
Solana Sentiment Hits 1-Year Low Amid Market Correction – Analyst Suggests Drop To $70 https://www.newsbtc.com/news/solana-sentiment-hits-1-year-low-amid-market-correction-analyst-suggests-drop-to-70/
Amid the market retrace, Solana (SOL) saw a massive correction that dragged its price to a five-mont...

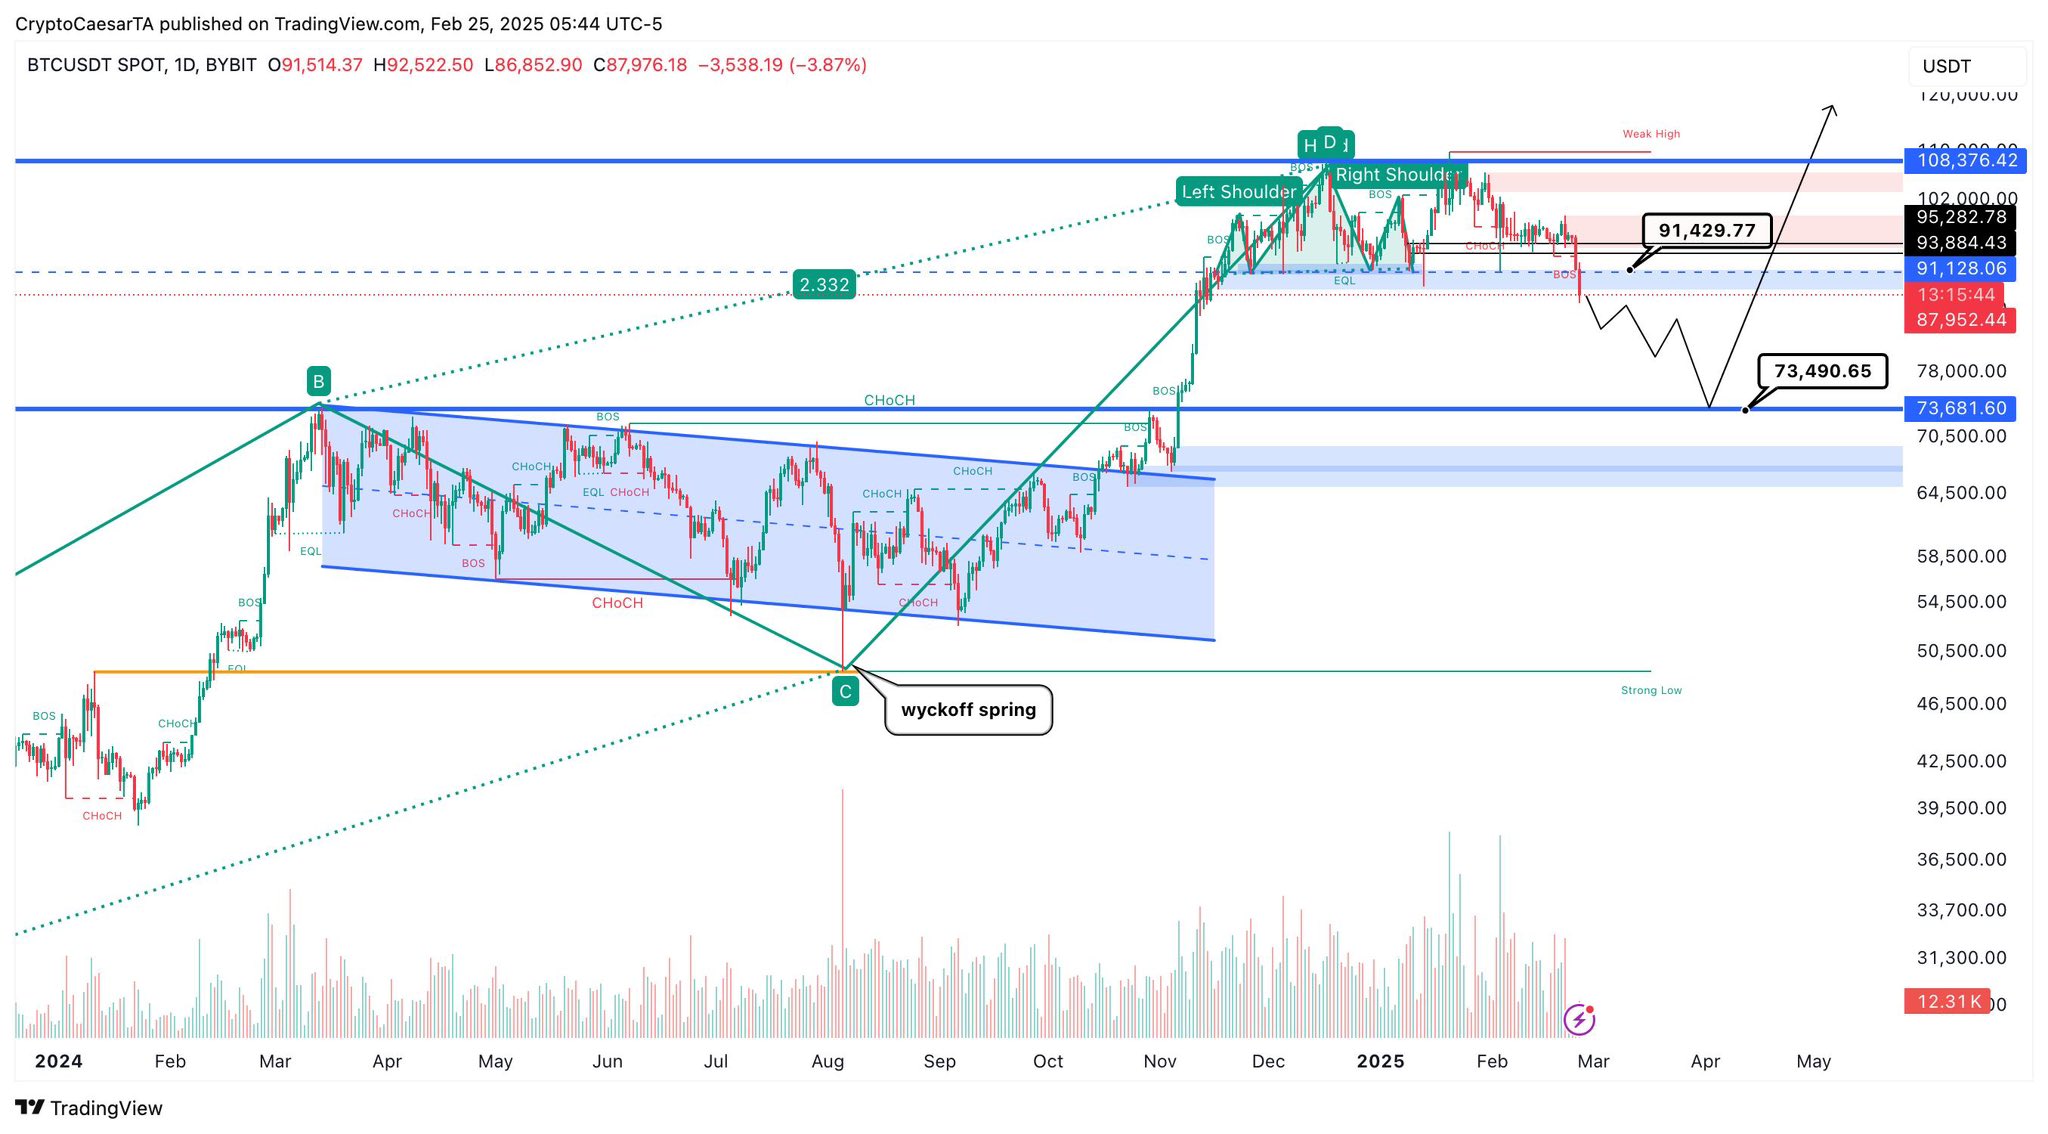
Bitcoin’s Ongoing Dip: Here’s What Analysts Are Saying https://www.newsbtc.com/bitcoin-news/bitcoins-ongoing-dip-heres-what-analysts-are-saying/
Bitcoin’s price has continued its decline, dropping below several key levels in recent days. As of n...

