Solana (SOL) Sees Red—What’s Next for the Price?


Solana started a fresh decline from the $162 zone. SOL price is down over 15% and might struggle to recover above the $150 resistance.
- SOL price started a fresh decline below the $162 and $150 levels against the US Dollar.
- The price is now trading below $150 and the 100-hourly simple moving average.
- There is a connecting bearish trend line forming with resistance at $144 on the hourly chart of the SOL/USD pair (data source from Kraken).
- The pair could start a fresh increase if the bulls clear the $150 zone.
Solana Price Dips Sharply
Solana price struggled to clear the $185 resistance and started a fresh decline, underperforming Bitcoin and Ethereum . SOL declined below the $162 and $150 support levels.
It even dived below the $135 level. The recent low was formed at $131 and the price is now consolidating losses with a bearish angle. There was a minor recovery wave above the 23.6% Fib retracement level of the downward move from the $173 swing high to the $131 swing low.
Solana is now trading below $145 and the 100-hourly simple moving average. On the upside, the price is facing resistance near the $144 level. There is also a connecting bearish trend line forming with resistance at $144 on the hourly chart of the SOL/USD pair.
The next major resistance is near the $150 level. The main resistance could be $152 and the 50% Fib retracement level of the downward move from the $173 swing high to the $131 swing low.
A successful close above the $152 resistance zone could set the pace for another steady increase. The next key resistance is $160. Any more gains might send the price toward the $165 level.
Another Decline in SOL?
If SOL fails to rise above the $145 resistance, it could start another decline. Initial support on the downside is near the $141 zone. The first major support is near the $136 level.
A break below the $136 level might send the price toward the $131 zone. If there is a close below the $125 support, the price could decline toward the $120 support in the near term.
Technical Indicators
Hourly MACD – The MACD for SOL/USD is losing pace in the bearish zone.
Hourly Hours RSI (Relative Strength Index) – The RSI for SOL/USD is below the 50 level.
Major Support Levels – $136 and $131.
Major Resistance Levels – $145 and $152.
Strategy (MSTR) Crashes 55%—Is A $44 Billion Bitcoin Liquidation Possible? https://www.newsbtc.com/bitcoin-news/strategy-mstr-crashes-44-billion-bitcoin-liquidation/
Shares of Strategy (NASDAQ: MSTR) have dropped by over 55% from the November 24 high at $543 to arou...

Top New Crypto to Buy as Binance CEO Assures Market Is in a ‘Tactical Retreat,’ Not a Reversal https://www.newsbtc.com/news/top-new-crypto-to-buy-as-binance-ceo-says-market-is-in-a-tactical-retreat-not-reversal/
Richard Teng, Binance’s CEO, firmly believes that the current crypto dump won’t last long. Referenci...
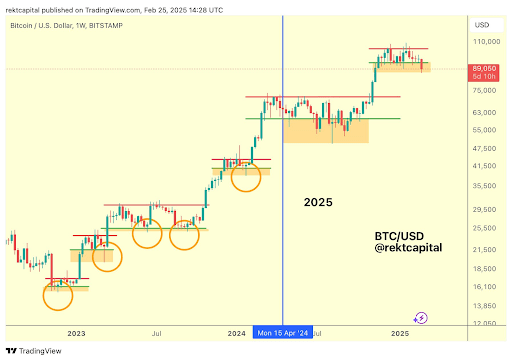
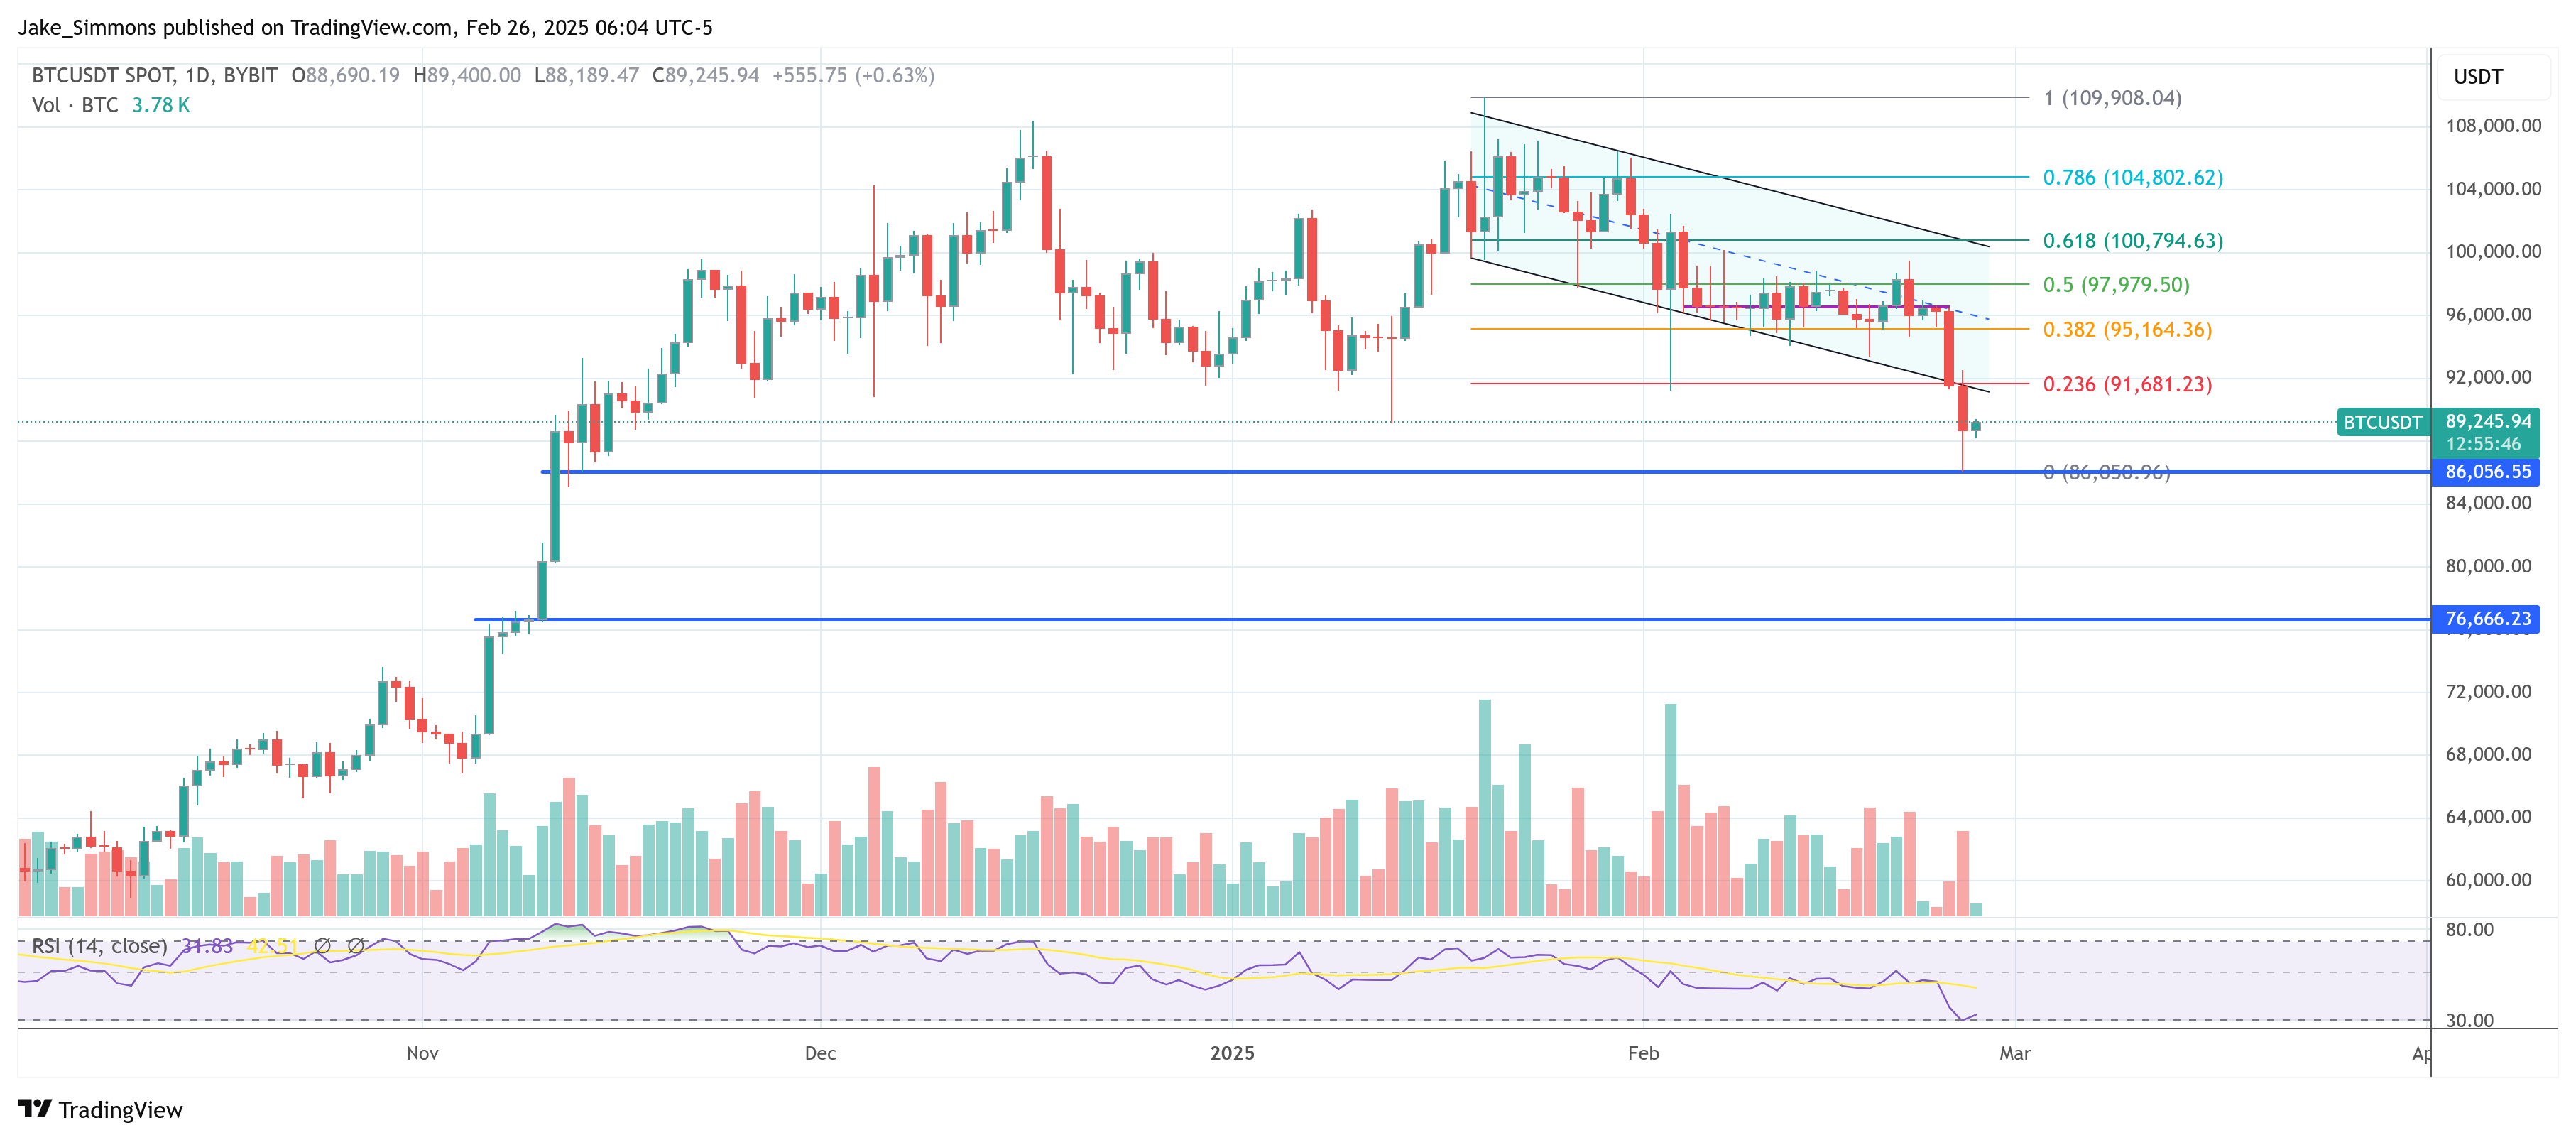
Bitcoin Enters Re-Accumulation Range After Crash Below $90,000, What To Expect https://www.newsbtc.com/news/bitcoin/bitcoin-re-accumulation-range/
Bitcoin’s recent price crash took the entire market by surprise, leaving bullish investors reeling i...