Bitcoin Price Holds Steady After Drop—Is a Rebound Coming?


Bitcoin price started a fresh decline below the $90,000 zone. BTC is back below $88,500 and might struggle to regain bullish momentum.
- Bitcoin started a fresh decline below the $92,000 zone.
- The price is trading below $90,000 and the 100 hourly Simple moving average.
- There is a connecting bearish trend line forming with resistance at $91,000 on the hourly chart of the BTC/USD pair (data feed from Kraken).
- The pair could start another decline if it fails to stay above the $85,000 zone.
Bitcoin Price Faces Resistance
Bitcoin price started a fresh decline from the $95,000 resistance level . BTC traded below the $92,000 and $90,000 support levels. The price dived over 10% and traded below the $88,000 support zone.
There was a clear move below the 50% Fib retracement level of the upward wave from the $84,500 swing low to the $95,000 high. Finally, the price tested the $82,000 support zone. A base was formed and the price is now recovering some losses above the $83,500 level.
Bitcoin price is now trading below $90,000 and the 100 hourly Simple moving average . On the upside, immediate resistance is near the $88,750 level. The first key resistance is near the $90,000 level.
The next key resistance could be $91,500. There is also a connecting bearish trend line forming with resistance at $91,000 on the hourly chart of the BTC/USD pair. A close above the $91,500 resistance might send the price further higher. In the stated case, the price could rise and test the $93,000 resistance level. Any more gains might send the price toward the $94,200 level or even $95,000.
Another Decline In BTC?
If Bitcoin fails to rise above the $90,000 resistance zone, it could start a fresh decline. Immediate support on the downside is near the $85,000 level. The first major support is near the $83,200 level.
The next support is now near the $82,250 zone and the 76.4% Fib retracement level of the upward wave from the $84,500 swing low to the $95,000 high. Any more losses might send the price toward the $80,000 support in the near term. The main support sits at $78,800.
Technical indicators:
Hourly MACD – The MACD is now losing pace in the bearish zone.
Hourly RSI (Relative Strength Index) – The RSI for BTC/USD is now above the 50 level.
Major Support Levels – $85,000, followed by $82,250.
Major Resistance Levels – $90,000 and $91,500.
Buy Dogecoin Now? Analyst Says This Is the Spot
Crypto analyst Kevin (known on X as @Kev_Capital_TA) has outlined what he deems a potentially ideal ...
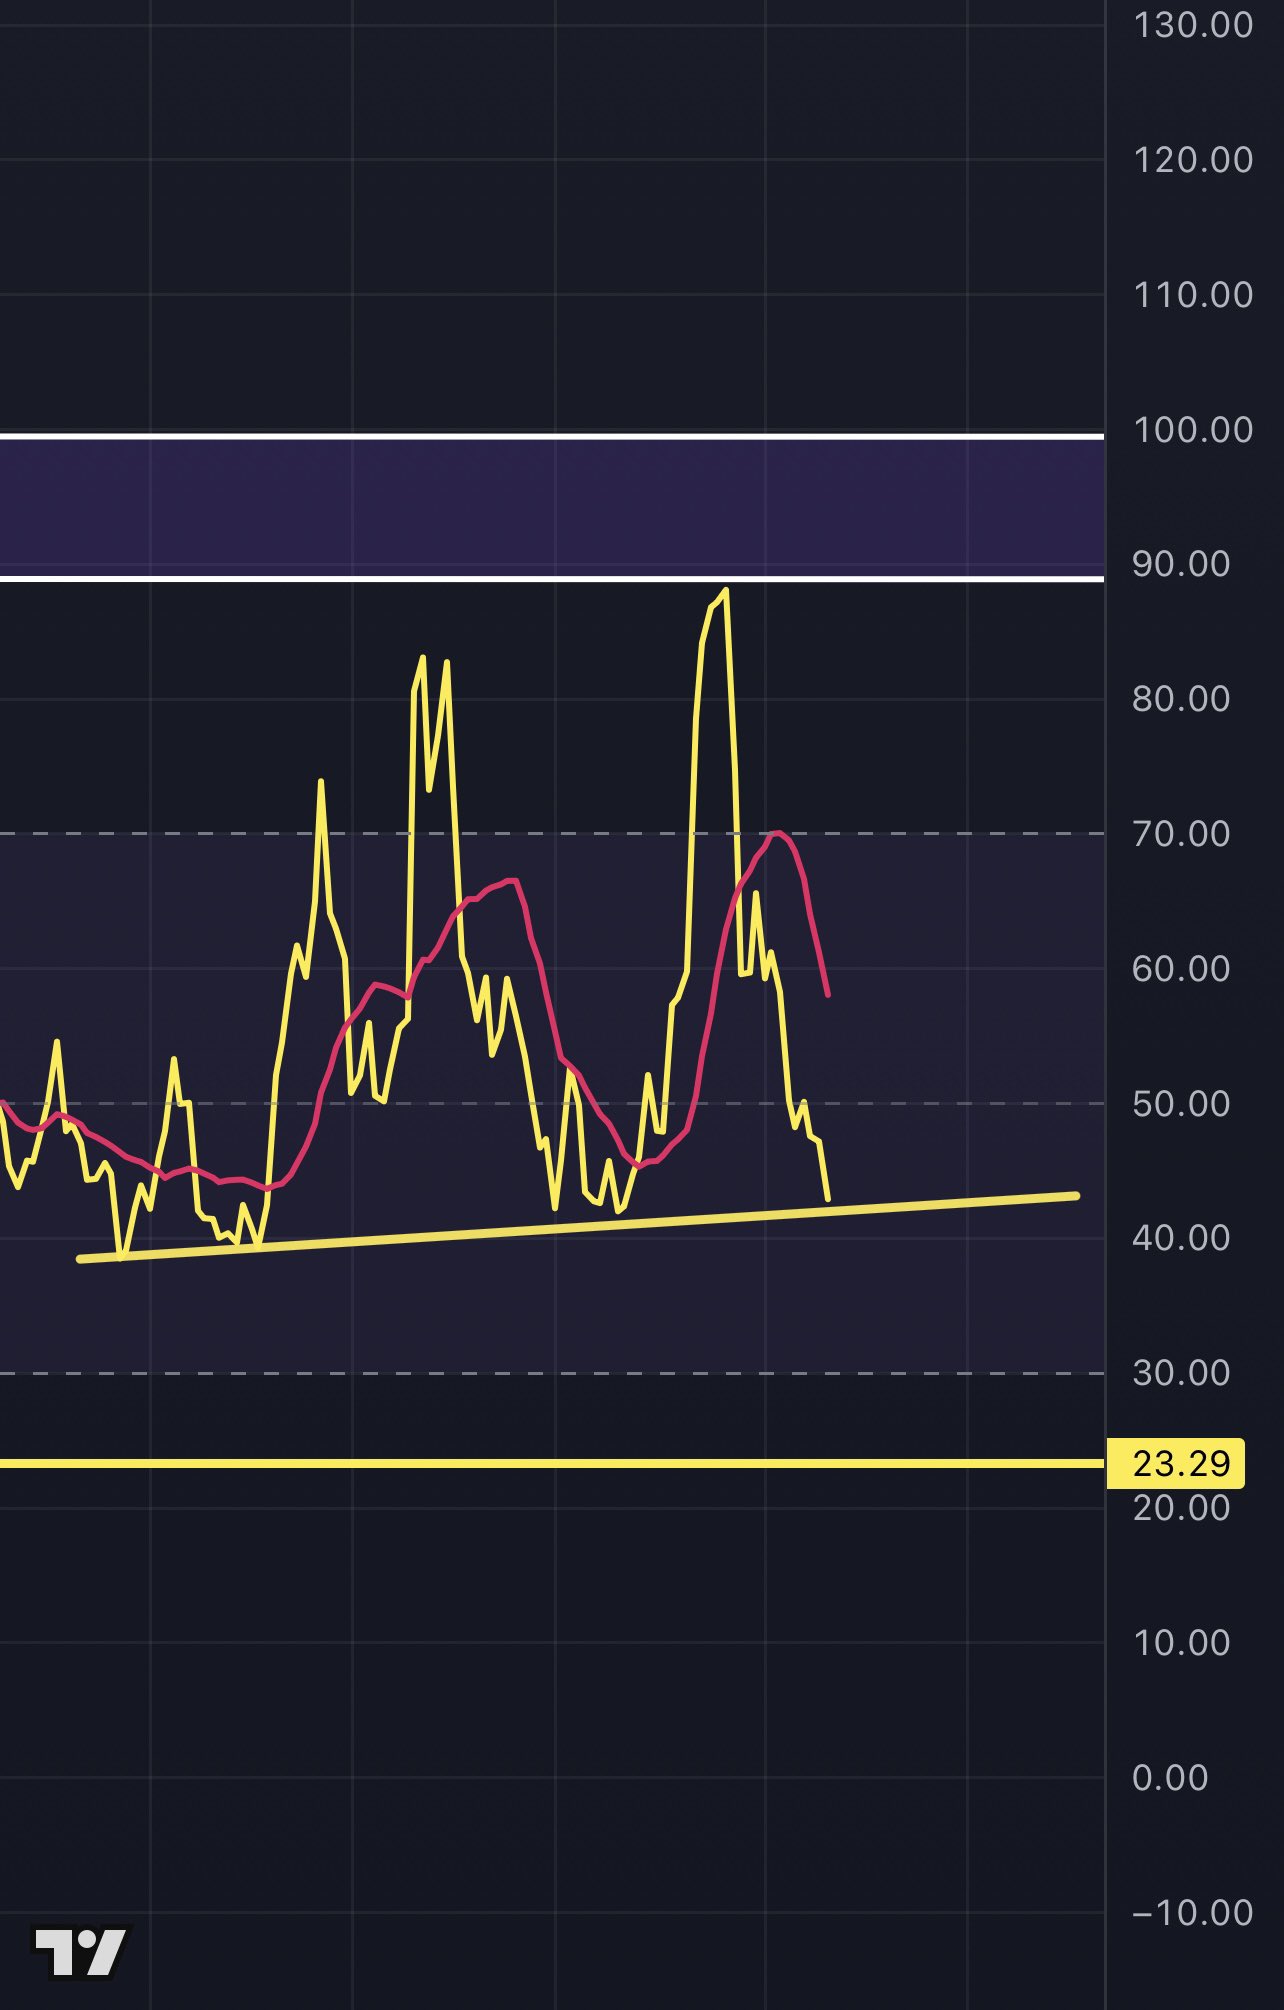
Ethereum In 2024 Vs. 2025: What Important Technical Indicators Are Saying
Crypto analyst Tony Severino has drawn similarities between Ethereum’s price action in 2024 and this...
Ethereum 2025 Price Prediction as Trump Announces US Crypto Reserve
Following its inclusion in Donald Trump’s newly announced US Crypto Reserve, Ethereum’s price predic...