Ethereum Rally Incoming? Analyst Predicts Breakout Beyond $2,100


Ethereum, the second-biggest cryptocurrency, is getting a lot of attention right now. Some experts who watch the market closely think its price could go above $2,100 soon. They’ve been looking at how Ethereum’s price has been moving and see patterns that suggest it might be heading up.
Short-Term Signs Point Upward
One analyst, Crypto Patel, shared his thoughts on the social media platform X. He pointed out a setup on the Ethereum chart that looks promising for a price increase.
Patel said Ethereum made a strong move upwards, which changed the way the market is structured. This happened after the price reacted to a level he had already identified as a good place for buyers to step in.
#Ethereum Prints Bullish Displacement – Swing High Liquidity in Sight $ETH Price respecting bullish POI with clear displacement on tap. Currently testing mitigation block post-retest. Anticipating bounce to sweep swing high liquidity at $2128.12.
Entry: $2064.60
— Crypto Patel (@CryptoPatel) March 25, 2025
Right now, Ethereum’s price is bouncing off a key area around $2,064. This area is called a mitigation block, and it often shows strong buying interest from big investors.
The idea is that these investors use this zone to adjust their previous orders before continuing to push the price in a certain direction. Patel suggests that buying in this upper part of the mitigation zone lines up with how these big players often operate.
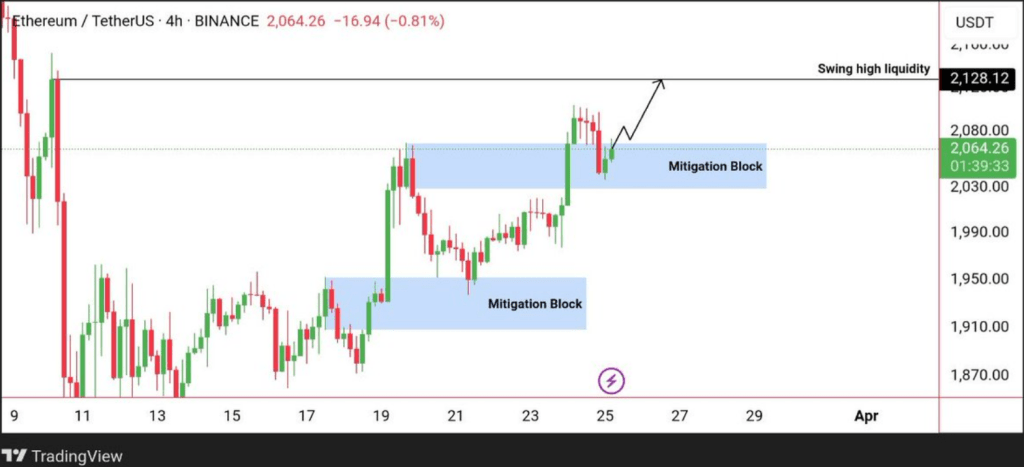
The target price Patel mentioned is $2,128. This level is what’s known as a swing high liquidity zone. These zones often have a lot of stop-loss orders and pending buy orders clustered together.
If the price moves into this area, it could trigger those orders and cause a sharp move, allowing investors to profit before the price possibly changes direction.
Patel set a stop-loss for this trade at $2,027, just below the mitigation block. This helps limit potential losses if his prediction is wrong.

Long-Term Pattern Looks Familiar
Another analyst, TimeFreedomROB, also posted on X. He compared Ethereum’s current weekly price pattern to what happened between 2018 and 2020.
His chart shows Ethereum breaking below an ascending triangle pattern, which is similar to how it broke below a descending triangle before its big recovery in 2020. Back then, Ethereum’s price hit a low point and then soared from under $100 to almost $4,800.
#ETH 1W
Price is showing the Same type of Break below support as last Cycle

Will Price Recover Rapidly Like Last Time?
pic.twitter.com/uoIDTd5w8L
— TimeFreedom ®0⃣

(@TimeFreedomROB) March 25, 2025
Currently, Ethereum is trading near $2,060. It recently dropped below the $2,300 mark and tested a lower trendline around $1800. This area also lines up with price levels where there was a lot of demand in previous years.
The analyst’s chart suggests this could be the final dip before a significant price increase, similar to what happened in past cycles.
The area between $1,800 and $2,000 has acted as a strong support level in the past. For Ethereum’s price to confirm a return to an upward trend on the weekly chart, it needs to climb back above the $2,200 to $2,400 range.
As of now, Ethereum is trading at $2,064. Over the last week, it has gained 6%. Its total market value is $250 billion, and the amount of Ethereum traded in the last 24 hours is $11.71 billion.
These analysts are presenting scenarios based on how Ethereum’s price has behaved in the past, but it’s important to remember that the cryptocurrency market can be unpredictable.
Featured image from Gemini Imagen, chart from TradingView
Bitcoin CME Gap Close About To Happen With Push Toward $83,000 – What Happens Next?
Bitcoin (BTC) is steadily approaching the highly anticipated Chicago Mercantile Exchange (CME) gap c...
Ethereum Bulls Disappointed As Recovery Attempt Fails At $2,160 Resistance
Ethereum’s attempt to regain bullish momentum has hit a roadblock, as the price failed to break thro...
Cardano Price To $0.77? ADA’s Potential Path To Recovery
The Cardano price has been on a slow roll lately, falling out of its $0.7 – $0.8 range over the past...