Ethereum Bulls Disappointed As Recovery Attempt Fails At $2,160 Resistance


Ethereum’s attempt to regain bullish momentum has hit a roadblock, as the price failed to break through the crucial $2,160 resistance level. After showing signs of recovery, ETH faced strong selling pressure at this key level, preventing a sustained breakout and disappointing bullish traders who were hoping for further upside.
Its inability to push past this resistance suggests that bears are still in control, keeping Ethereum’s price under pressure. With the momentum fading and the market sentiment turning cautious, traders are now closely watching key support zones to determine the next move.
Bearish Pressure Mounts: What’s Next For Ethereum?
Ethereum is facing increasing downside pressure as its latest recovery attempt was rejected at the $2,160 resistance level. The failed breakout has reinforced bearish sentiment , with key technical indicators signaling weakness. If buyers fail to step in, ETH could be at risk of deeper declines in the near term.
One of the major warning signs is weak volume during the recovery attempt. A strong breakout typically requires significant buying interest, but Ethereum’s rally lacked momentum, making it easier for sellers to regain control. This lack of conviction from bulls suggests that the upside move was not sustainable, allowing bears to push prices lower.
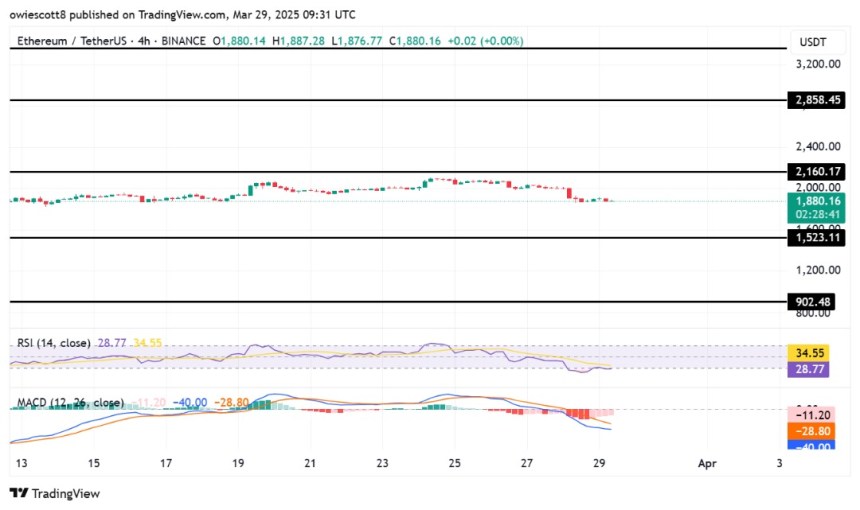
Additionally, the Relative Strength Index (RSI) has broken down , moving below key thresholds that indicate weakening bullish strength. The current declining RSI shows that buying pressure is fading, making it difficult for Ethereum to build upward momentum. If the RSI continues trending downward, it could further confirm a prolonged bearish phase.
The Moving Average Convergence Divergence (MACD) has also turned negative, with a breakdown below the signal line and a widening gap between the MACD and its moving average. This crossover indicates that bearish momentum is accelerating, reducing the chances of an immediate recovery. When combined with other bearish signals, the MACD breakdown further supports the case for a continued downside .
Looking ahead, ETH may retest key support zones. However, a strong bounce from lower levels could offer bulls another chance to regain lost ground. For now, the charts suggest that Ethereum remains vulnerable to further declines.
Support Levels To Watch: Can Bulls Prevent Further Decline?
With attention now turning to key support levels , the first major support to watch is around $1,523, a level that previously acted as a short-term demand zone. If Ethereum holds above this area, it might provide bulls with a foundation for another rebound attempt. However, a break below this level could signal growing bearish dominance, increasing the risk of deeper losses.
Below $1,523, the next key support lies at $902, aligning with previous price reactions and acting as a psychological level for traders. A failure to hold here may accelerate selling pressure, pushing ETH toward other support below.

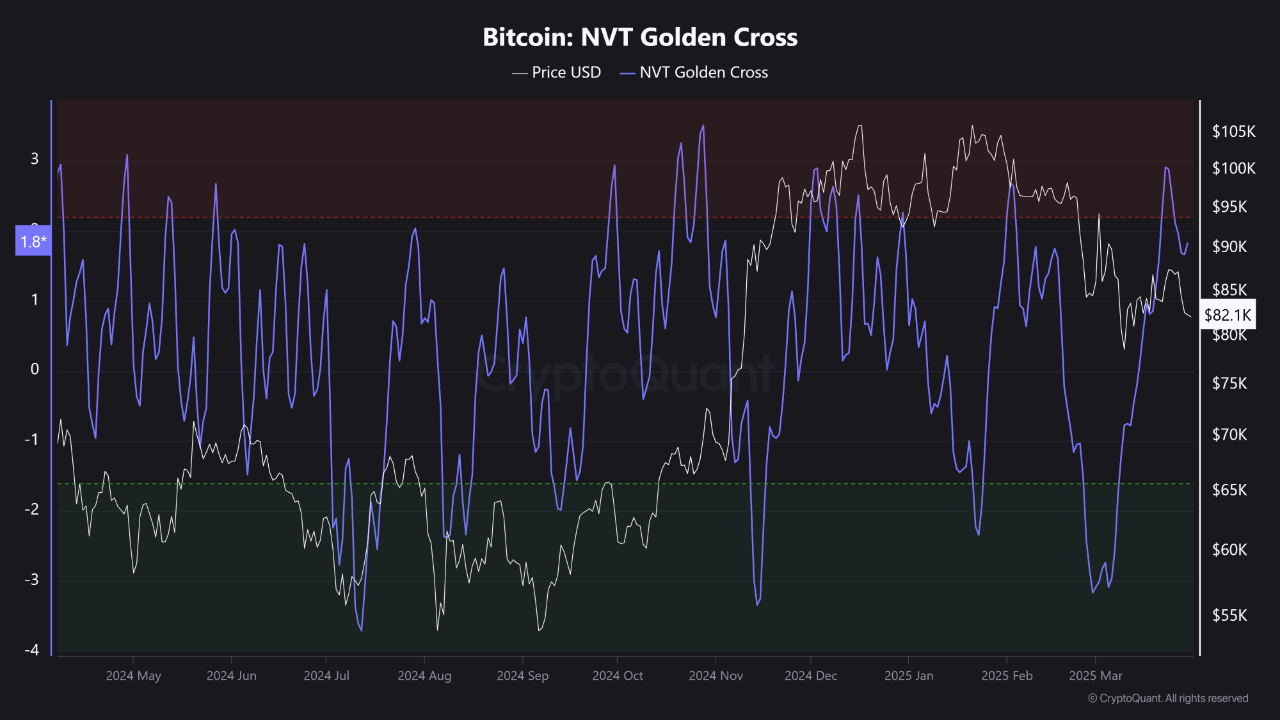
Will Bitcoin Downtrend Continue? This Metric Suggests Yes
On-chain data shows the Bitcoin Network Value to Transactions (NVT) Golden Cross is currently showin...
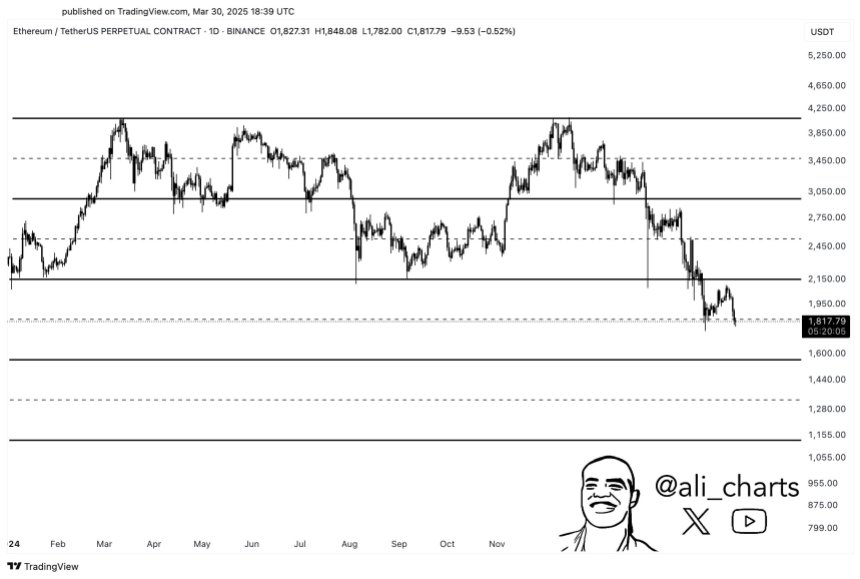
Ethereum Trend Reversal At Stake: $2,300 Emerges As The Most Crucial Resistance
As Ethereum (ETH) continues to experience a significant price downturn, recording a 17% drop over th...
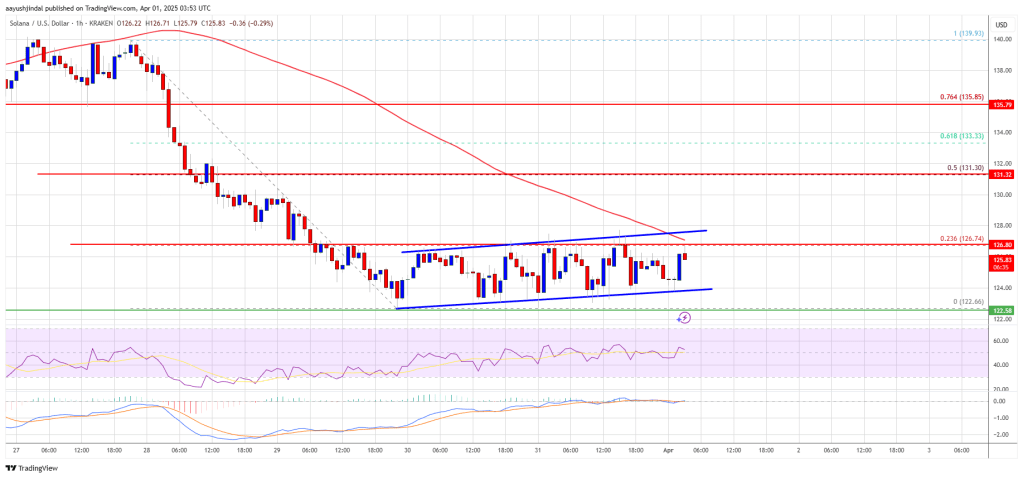
Solana (SOL) Holds Steady After Decline—Breakout or More Downside?
Solana started a fresh decline below the $132 support zone. SOL price is now consolidating and might...