XRP Price Prediction for April 1: Is XRP Poised for Recovery or Further Decline?


- XRP faces a 35% decline in 2025 despite legal progress with the SEC.
- Market confidence in XRP’s price growth has dropped from 90% to 4%.
- Technical indicators show bearish signals, with XRP nearing oversold conditions.
The Ripple community is watching closely as XRP approaches a key legal development in its ongoing battle with the U.S. Securities and Exchange Commission (SEC). With a resolution expected within the next 60 days, there are growing hopes that this could lead to the approval of an XRP exchange-traded fund (ETF), offering a boost to investor sentiment.
Despite this possible legal turning point, the price performance of XRP paints a different picture, as the digital asset has faced declines in early 2025.
XRP has been one of the most affected assets among the majors, with a 35% drop in value starting from the beginning of 2025. This slump has persisted even with XRP working as part of the US strategic reserve like other assets such as Bitcoin, Ethereum, Cardano, and Solana.
Market sentiment around XRP has changed in recent months. According to Polymarket betting data, the chances of XRP reaching a new all-time high before July 2025 have dropped from nearly 90% following Donald Trump’s inauguration to just 4% now.
Current Market Data and Liquidation Trends
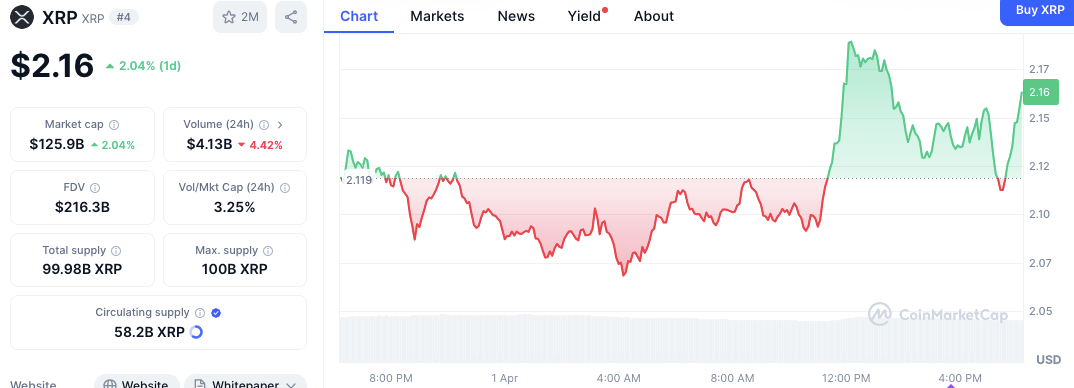
The market performance of XRP fluctuates, showing both gains and losses. According to the latest data, XRP has increased its value by 2.04%, giving it a price of $2.16. However, the 24-hour trading volume has declined to 4.42%, equal to $4.13 billion. XRP’s market cap is $125.9 billion, and its circulating supply is 58.2 billion out of a total supply of 99.98 billion, with a maximum supply cap set at 100 billion XRP.

The volatility of XRP is seen when examining its price fluctuations over the past 24 hours. The price surged to a high of around $2.17 before dipping below $2.10, reflecting the ongoing market uncertainty. The trading volume-to-market cap ratio is 3.25%, indicating low trading activity relative to the asset’s market size.
Liquidation Data Highlights Market Reactivity
The XRP Total Liquidations Chart displays the fluctuating nature of the asset’s price and liquidation events. From October 2023 through March 2024, XRP experienced varying levels of volatility, with significant short and long liquidations during price movements.

Notably, liquidations increased during price surges in late 2023 and early 2024, displaying the market’s reactive nature. As of March 2024, XRP’s price appears to have stabilized around $2.00, with liquidation events dropping off after the rise in early March.
Technical Indicators Show Bearish Signals
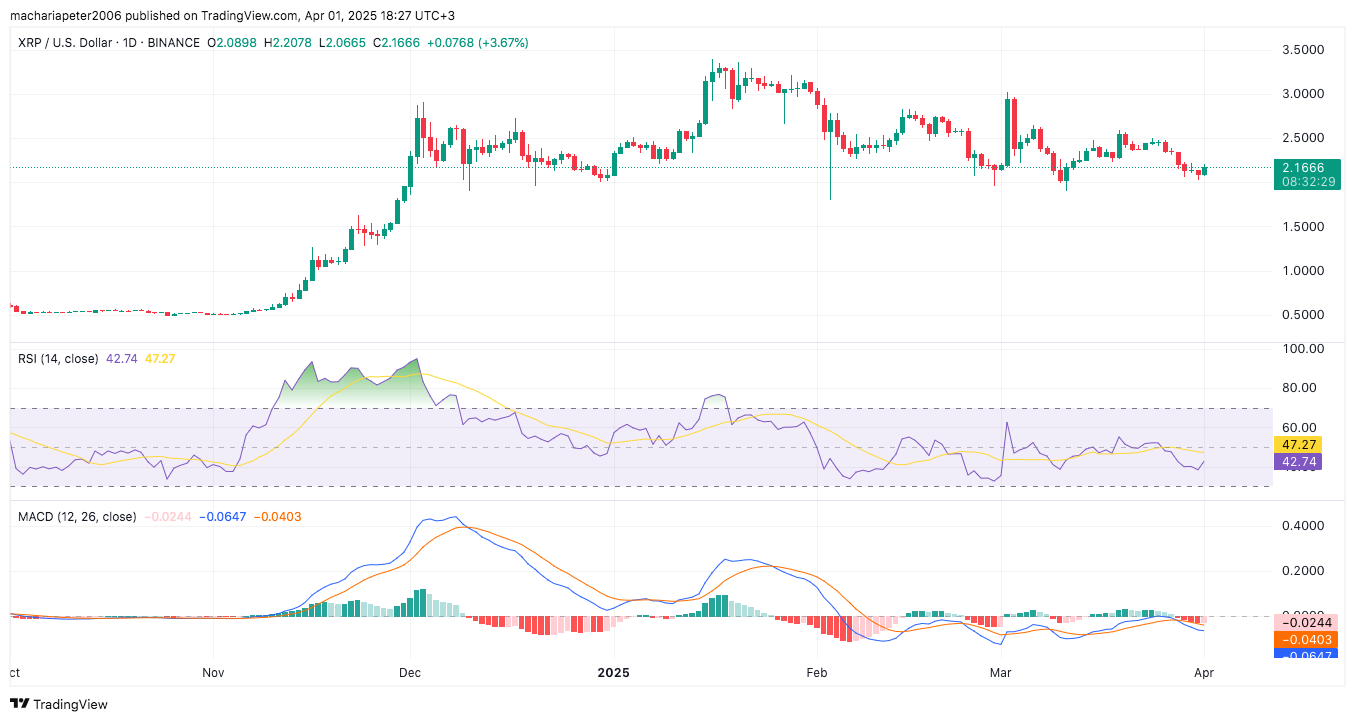
Technical analysis gives further insight into XRP’s possible price direction. The Relative Strength Index (RSI) stands at 42.74, indicating that XRP is nearing oversold conditions but has not yet entered the oversold zone.

In terms of the overall picture, this points to further negative pressure on the asset, but recovery might be possible if the trend changes. Likewise, there is a bearish Moving Average Convergence Divergence (MACD) formation, whereby the MACD line rests below the signal line, indicating that more selling pressure is expected until the onset of bullish pressure.
FAQs:
Why is XRP’s price declining despite legal progress with the SEC?
Despite ongoing legal progress, XRP’s price dropped by 35% in 2025 due to poor market sentiment and declining investor confidence. The price-performance does not align with legal expectations, highlighting challenges in the market.
What is the current market cap and supply of XRP?
XRP’s market cap is $125.9 billion, with a circulating supply of 58.2 billion XRP out of a total supply of 99.98 billion. The maximum supply cap is set at 100 billion XRP.
What do the technical indicators suggest about XRP’s future?
The Relative Strength Index (RSI) is at 42.74, nearing oversold conditions, while the MACD shows a bearish crossover. These signals suggest that XRP may continue to face downward pressure unless a shift in momentum occurs.

PENGU Price Prediction for April 2: Can It Rebound After Falling Below $0.005?
PENGU drops 3.54% to $0.005065 despite a 31.67% volume surge, as $PENGU RSI nears oversold and MACD ...

Qubetics: The Underdog Crypto Rising, As Binance and Bitcoin Soar – Best Cryptos to Invest in Today
Discover the best cryptos to invest in today! Explore Qubetics, Binance, and Bitcoin and learn what ...

Trust Wallet Review 2025 – Best Crypto Wallet for Beginners
Discover our Trust Wallet review for 2025, exploring its features, security, user experience, and co...

