Bitcoin Price Rockets to Record High — Bulls Celebrate Milestone


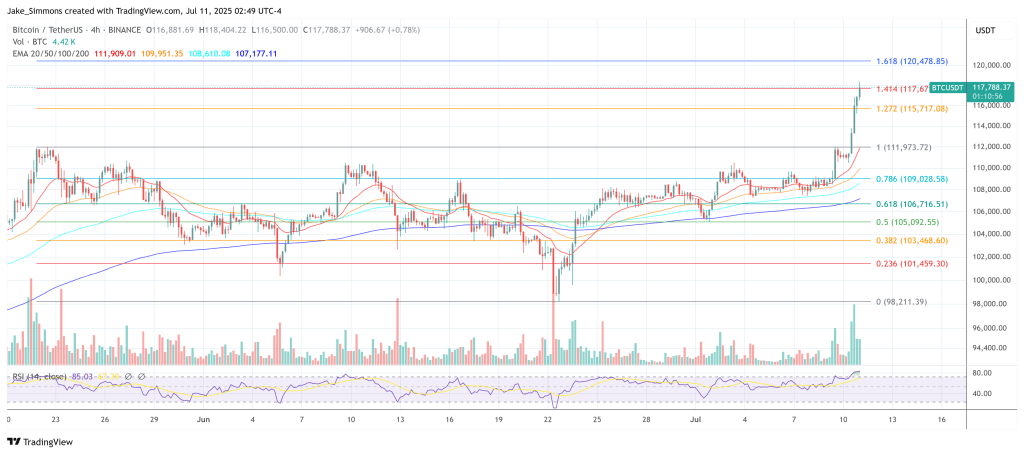
Bitcoin price started a fresh increase above the $110,500 zone. BTC is now up over 5%, traded to a new high, and extend gains above the $116,000 level.
- Bitcoin started a fresh increase above the $112,500 zone.
- The price is trading above $113,500 and the 100 hourly Simple moving average.
- There was a break above a bearish trend line with resistance at $111,000 on the hourly chart of the BTC/USD pair (data feed from Kraken).
- The pair could continue to rise if it clears the $116,800 resistance zone.
Bitcoin Price Sets New ATH
Bitcoin price started a fresh increase after it cleared the $110,500 resistance zone. BTC gained pace for a move above the $112,000 and $113,500 resistance.
Besides, there was a break above a bearish trend line with resistance at $111,000 on the hourly chart of the BTC/USD pair. The bulls even pumped the pair above the $115,000 resistance zone. A new all-time high was formed at $116,800 and the price is now consolidating gains above the 23.6% Fib retracement level of the upward move from the $110,600 swing low to the $116,800 high.
Bitcoin is now trading above $113,500 and the 100 hourly Simple moving average . Immediate resistance on the upside is near the $116,000 level. The first key resistance is near the $116,200 level. The next resistance could be $116,800.
A close above the $116,800 resistance might send the price further higher. In the stated case, the price could rise and test the $118,000 resistance level. Any more gains might send the price toward the $118,800 level. The main target could be $120,000.
Downside Correction In BTC?
If Bitcoin fails to rise above the $116,800 resistance zone, it could start a downside correction. Immediate support is near the $115,300 level. The first major support is near the $113,700 level or the 50% Fib retracement level of the upward move from the $110,600 swing low to the $116,800 high.
The next support is now near the $113,200 zone. Any more losses might send the price toward the $112,500 support in the near term. The main support sits at $110,500, below which BTC might continue to move down.
Technical indicators:
Hourly MACD – The MACD is now gaining pace in the bullish zone.
Hourly RSI (Relative Strength Index) – The RSI for BTC/USD is now above the 50 level.
Major Support Levels – $115,300, followed by $113,700.
Major Resistance Levels – $116,800 and $118,000.

Research Predicts $160,000 Bitcoin By EOY—If Treasury Firms Hold
A sweeping new research report by Ben Harvey and Will Clemente III, commissioned by market maker Key...

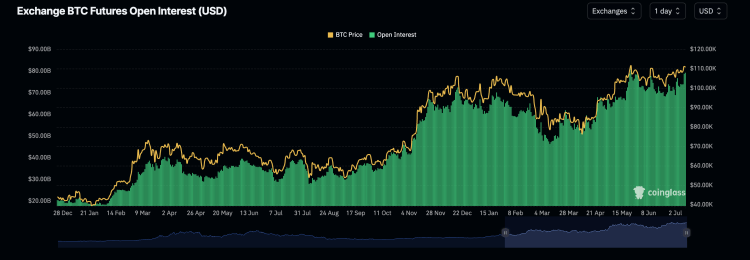
Bitcoin Open Interest Climbs Above December 2024 Levels, Here’s What Happened Last Time
The Bitcoin open interest has risen rapidly once again, with the price pushing above previous peaks ...

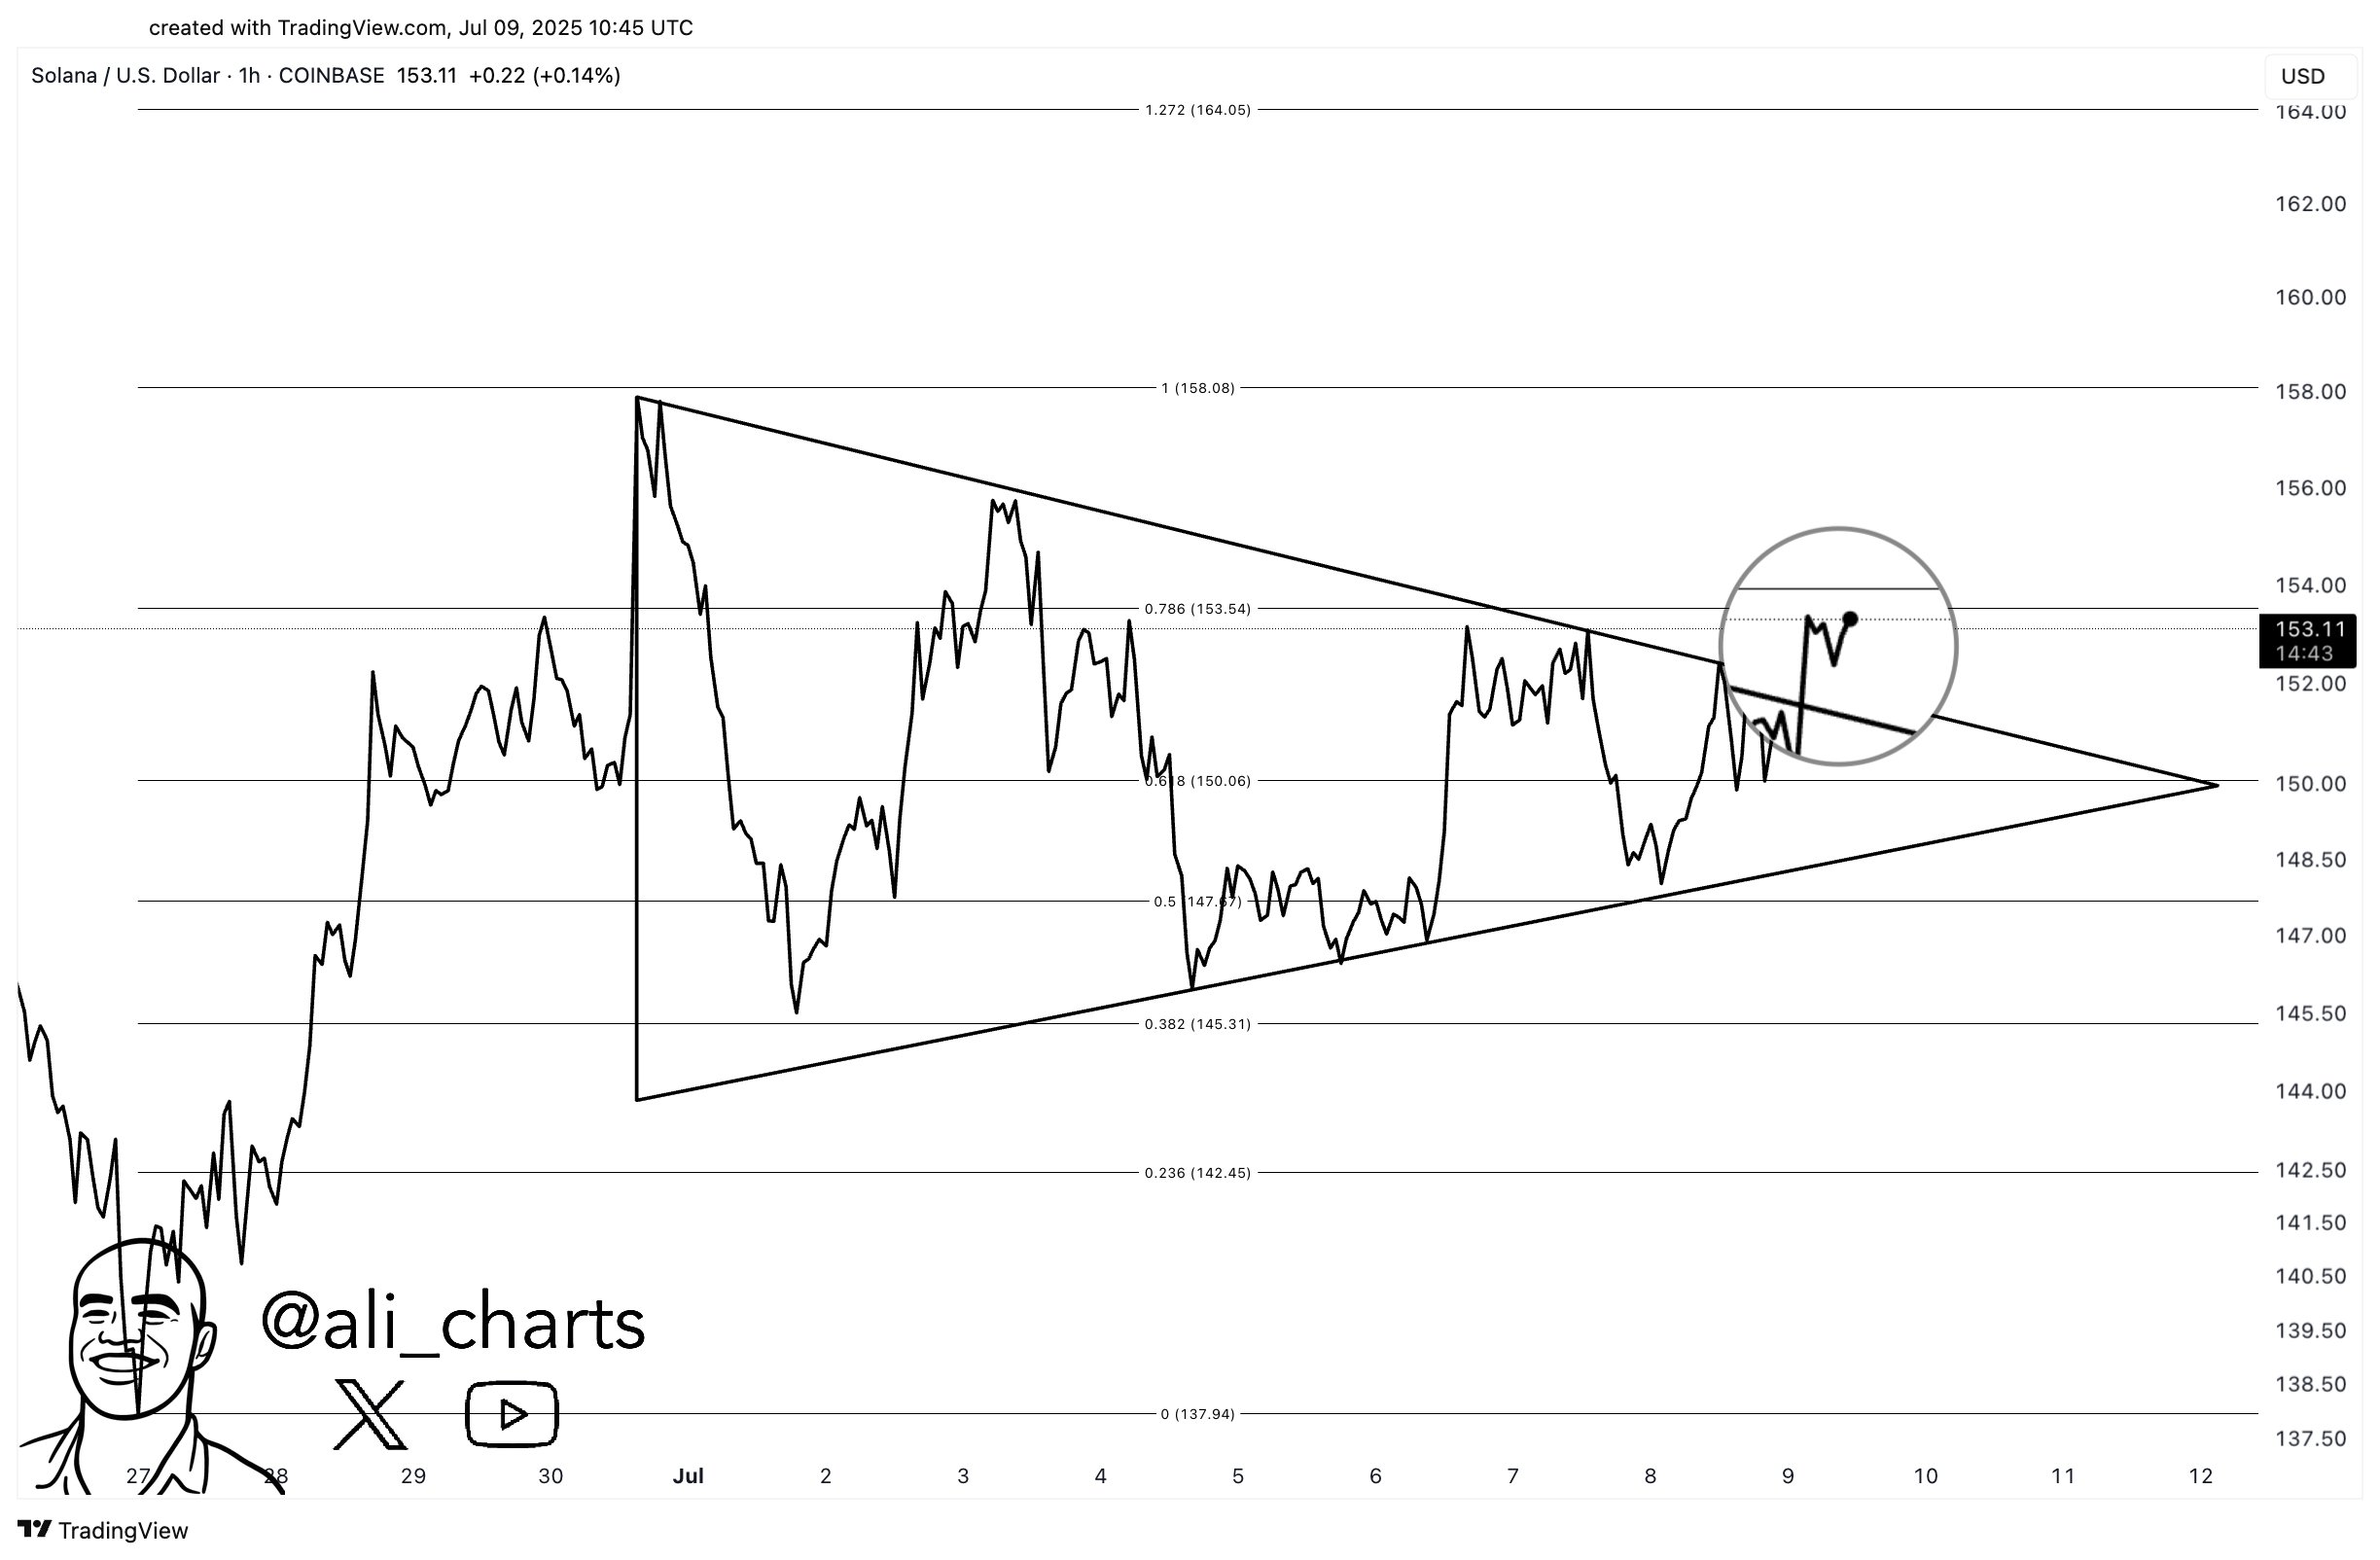
Solana Breaks Out Of Symmetrical Triangle—Next Stop $164?
Solana has shown a potential breakout from a Symmetrical Triangle. Here’s where the next price targe...

