Bitcoin Price Rockets to Record High — Bulls Celebrate Milestone


Bitcoin price started a fresh increase above the $110,500 zone. BTC is now up over 5%, traded to a new high, and extend gains above the $116,000 level.
- Bitcoin started a fresh increase above the $112,500 zone.
- The price is trading above $113,500 and the 100 hourly Simple moving average.
- There was a break above a bearish trend line with resistance at $111,000 on the hourly chart of the BTC/USD pair (data feed from Kraken).
- The pair could continue to rise if it clears the $116,800 resistance zone.
Bitcoin Price Sets New ATH
Bitcoin price started a fresh increase after it cleared the $110,500 resistance zone. BTC gained pace for a move above the $112,000 and $113,500 resistance.
Besides, there was a break above a bearish trend line with resistance at $111,000 on the hourly chart of the BTC/USD pair. The bulls even pumped the pair above the $115,000 resistance zone. A new all-time high was formed at $116,800 and the price is now consolidating gains above the 23.6% Fib retracement level of the upward move from the $110,600 swing low to the $116,800 high.
Bitcoin is now trading above $113,500 and the 100 hourly Simple moving average . Immediate resistance on the upside is near the $116,000 level. The first key resistance is near the $116,200 level. The next resistance could be $116,800.
A close above the $116,800 resistance might send the price further higher. In the stated case, the price could rise and test the $118,000 resistance level. Any more gains might send the price toward the $118,800 level. The main target could be $120,000.
Downside Correction In BTC?
If Bitcoin fails to rise above the $116,800 resistance zone, it could start a downside correction. Immediate support is near the $115,300 level. The first major support is near the $113,700 level or the 50% Fib retracement level of the upward move from the $110,600 swing low to the $116,800 high.
The next support is now near the $113,200 zone. Any more losses might send the price toward the $112,500 support in the near term. The main support sits at $110,500, below which BTC might continue to move down.
Technical indicators:
Hourly MACD – The MACD is now gaining pace in the bullish zone.
Hourly RSI (Relative Strength Index) – The RSI for BTC/USD is now above the 50 level.
Major Support Levels – $115,300, followed by $113,700.
Major Resistance Levels – $116,800 and $118,000.

Don’t Hold Back—Expert Recommends Full Stake In XRP
A top crypto analyst is making waves with a strong call: Going all-in on XRP should be a priority. T...
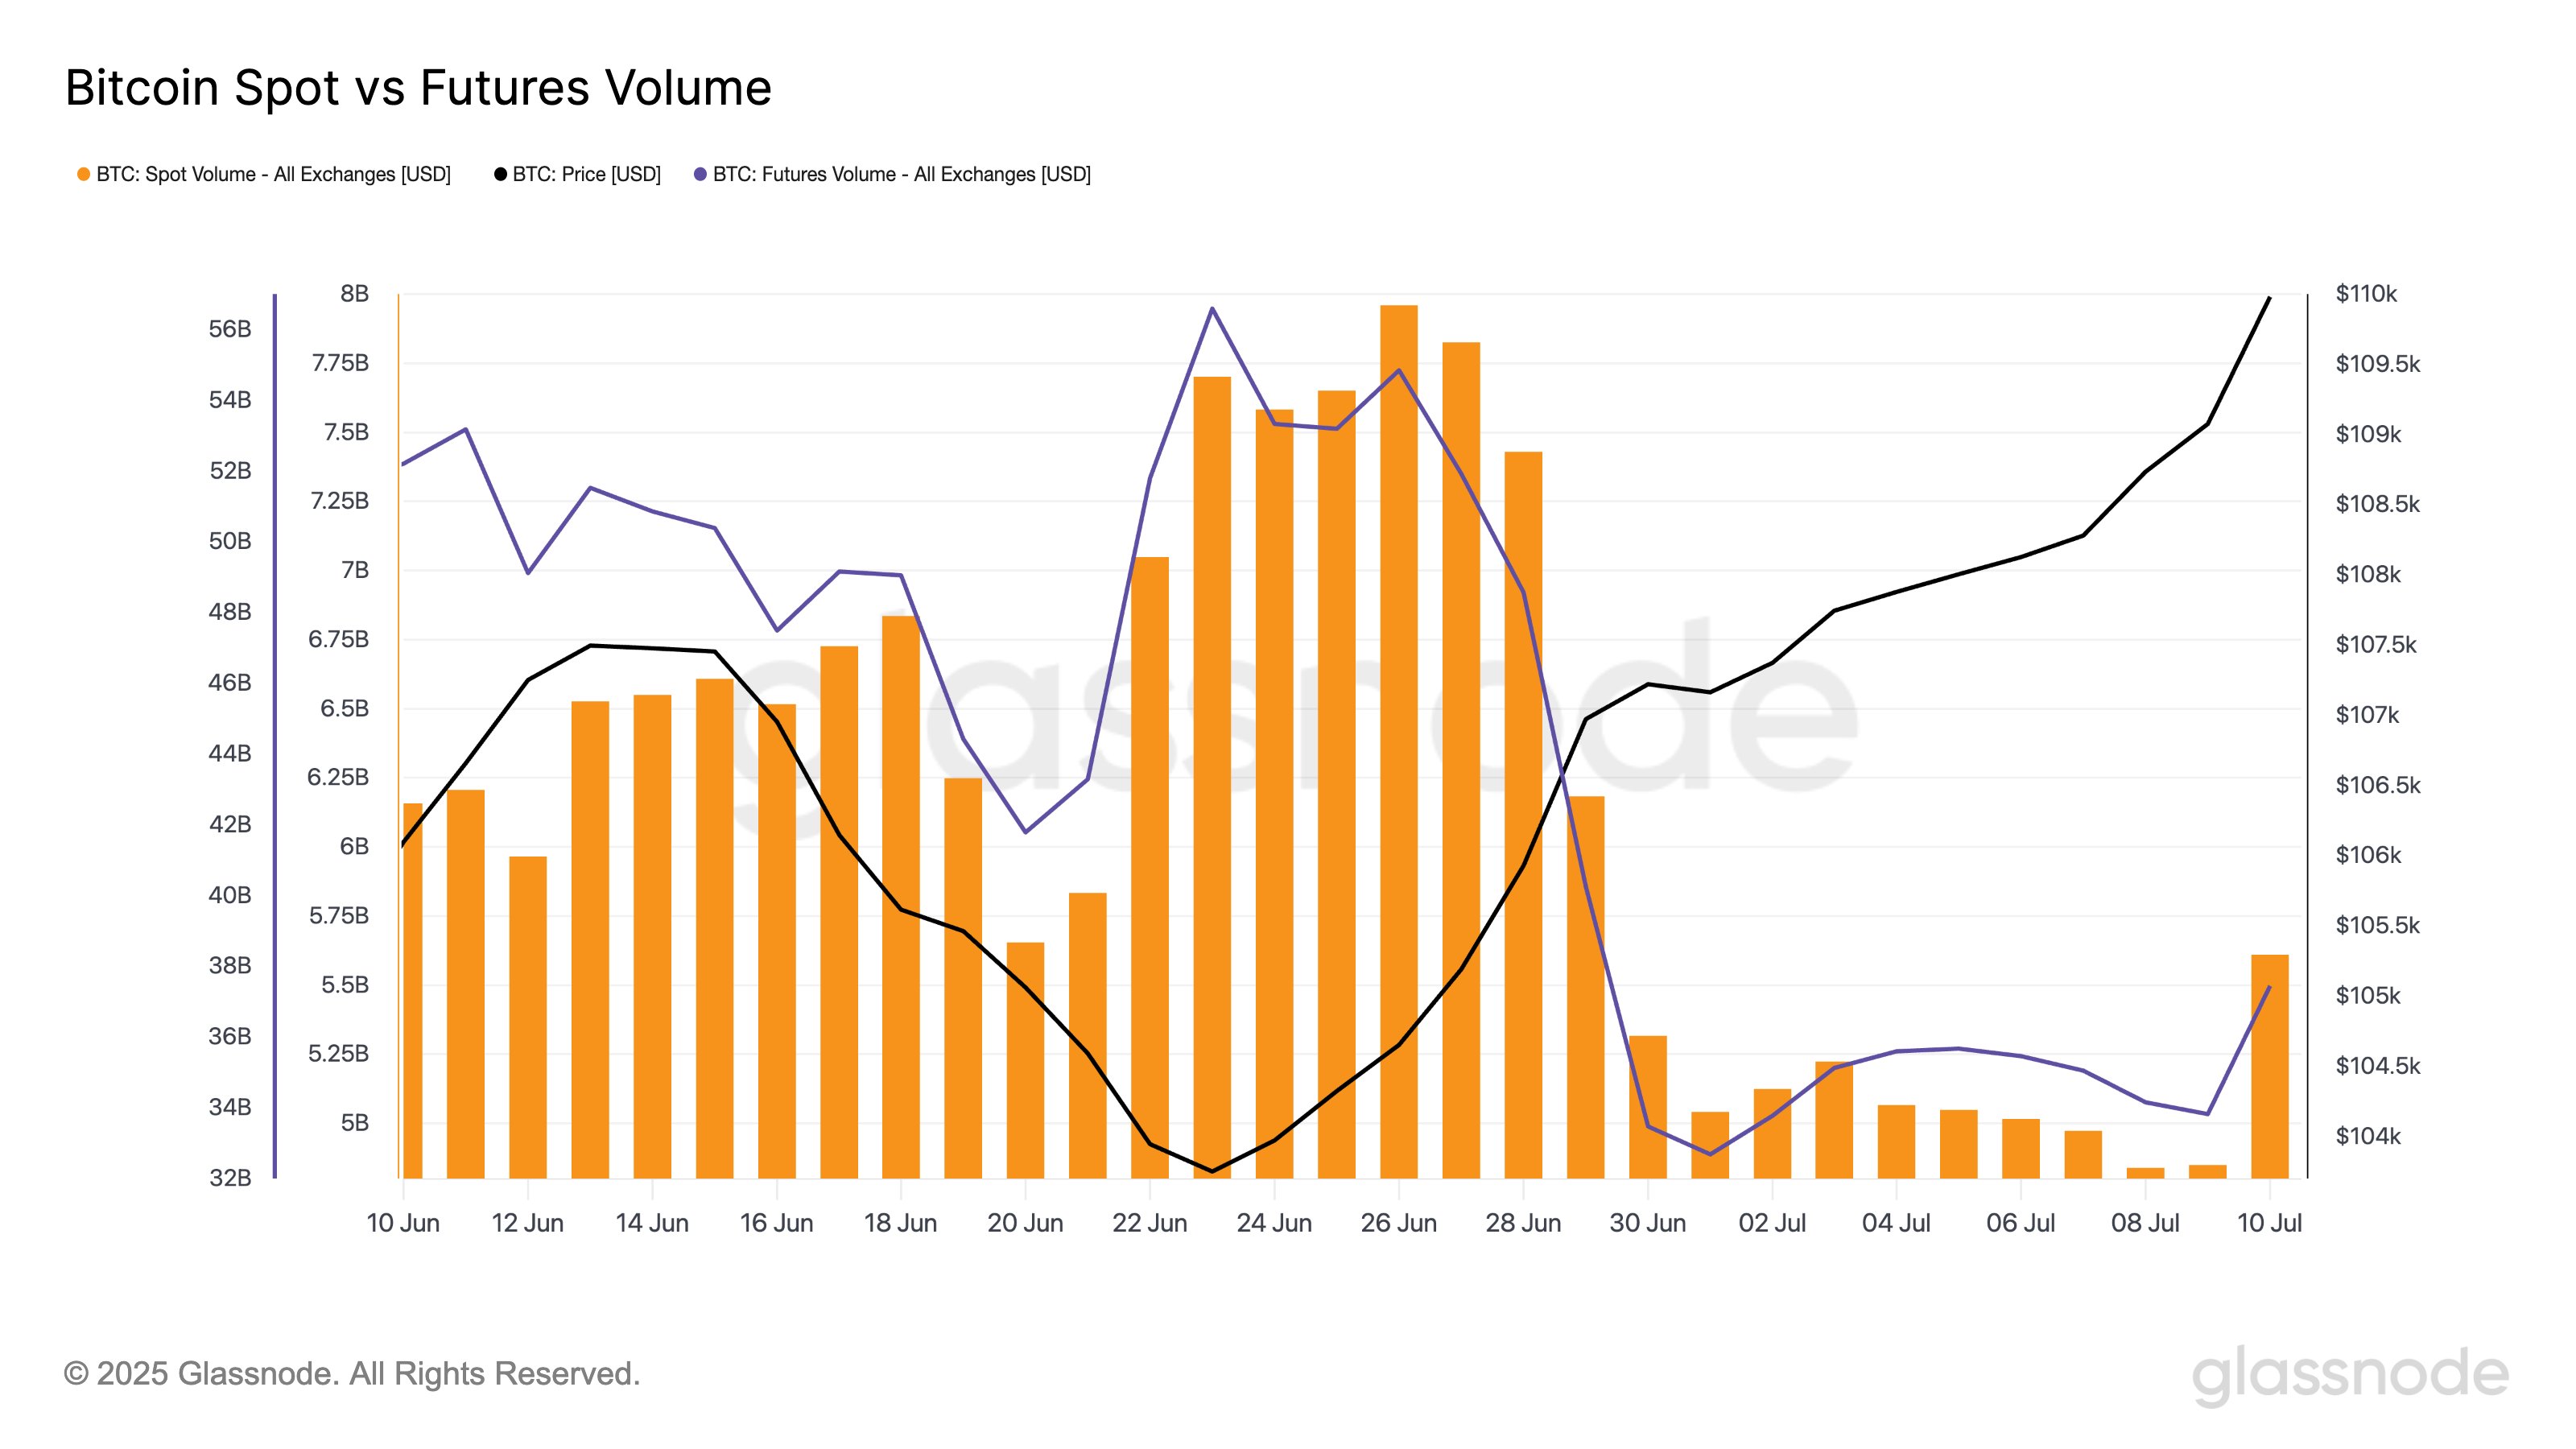
Bitcoin Breaks $118,000—But Liquidity Still Thin, Glassnode Warns
Bitcoin has set a new all-time high (ATH) above $118,000, but on-chain data from Glassnode shows BTC...
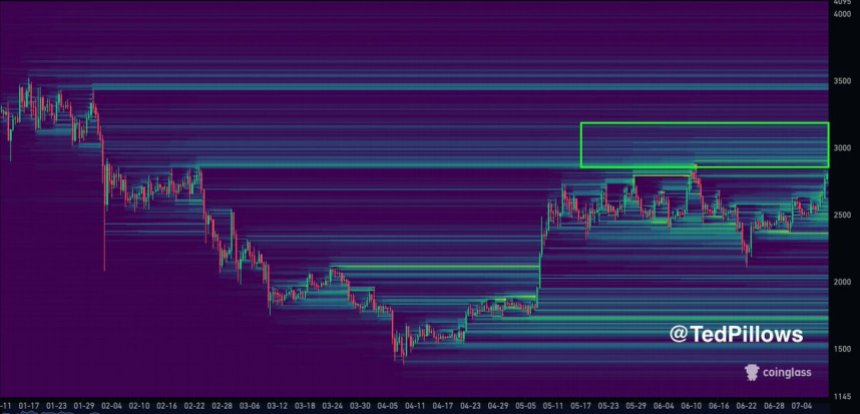
Ethereum Targets Liquidity Above $3,000 – Price Magnet Forming
Ethereum just broke above the critical $3,000 level, marking a major technical milestone after surgi...