XRP Price Declines Further – Is a Bigger Crash on the Horizon?


XRP price is struggling to recover above the $3.00 resistance zone. The price is now declining and might extend losses if it drops below $2.70.
- XRP price is correcting gains below the $3.00 resistance.
- The price is now trading below $2.850 and the 100-hourly Simple Moving Average.
- There is a key bearish trend line forming with resistance at $2.80 on the hourly chart of the XRP/USD pair (data source from Kraken).
- The pair could continue to decline if it stays below the $2.850 zone.
XRP Price Dips Below Support
XRP price started a fresh decline below $3.00, like Bitcoin and Ethereum . The price traded below the $2.950 and $2.920 levels to enter a bearish zone.
The bears were able to push the price below $2.850 and the 100-hourly Simple Moving Average. Finally, the price declined below $2.80 and tested $2.74. A low was formed at $2.738 and the price is now consolidating losses below the 23.6% Fib retracement level of the downward move from the $3.040 swing high to the $2.738 low.
The price is now trading below $2.80 and the 100-hourly Simple Moving Average. There is also a key bearish trend line forming with resistance at $2.80 on the hourly chart of the XRP/USD pair.
If the bulls protect the $2.720 support, the price could attempt another increase. On the upside, the price might face resistance near the $2.80 level. The first major resistance is near the $2.820 level. A clear move above the $2.820 resistance might send the price toward the $2.850 resistance.
Any more gains might send the price toward the $2.90 resistance or the 50% Fib retracement level of the downward move from the $3.040 swing high to the $2.738 low. The next major hurdle for the bulls might be near $3.00.
More Losses?
If XRP fails to clear the $2.820 resistance zone, it could continue to move down. Initial support on the downside is near the $2.720 level. The next major support is near the $2.650 level.
If there is a downside break and a close below the $2.650 level, the price might continue to decline toward $2.60. The next major support sits near the $2.50 zone, below which the price could gain bearish momentum.
Technical Indicators
Hourly MACD – The MACD for XRP/USD is now gaining pace in the bearish zone.
Hourly RSI (Relative Strength Index) – The RSI for XRP/USD is now below the 50 level.
Major Support Levels – $2.720 and $2.650.
Major Resistance Levels – $2.850 and $2.90.

Pundit Calls Bitcoin Price Crash Below $93,000, Reveals Bear Targets From Here
After hitting a new all-time high last month, the Bitcoin price has since retraced by more than 10%,...
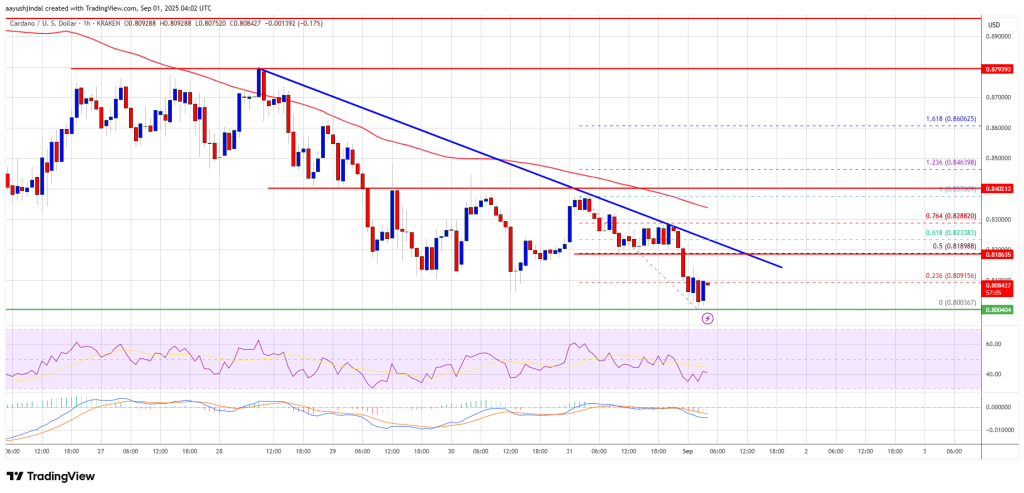
Cardano (ADA) Faces Selling Pressure – Is This the Start of a Trend?
Cardano price started a fresh decline below the $0.850 zone. ADA is now consolidating and might exte...
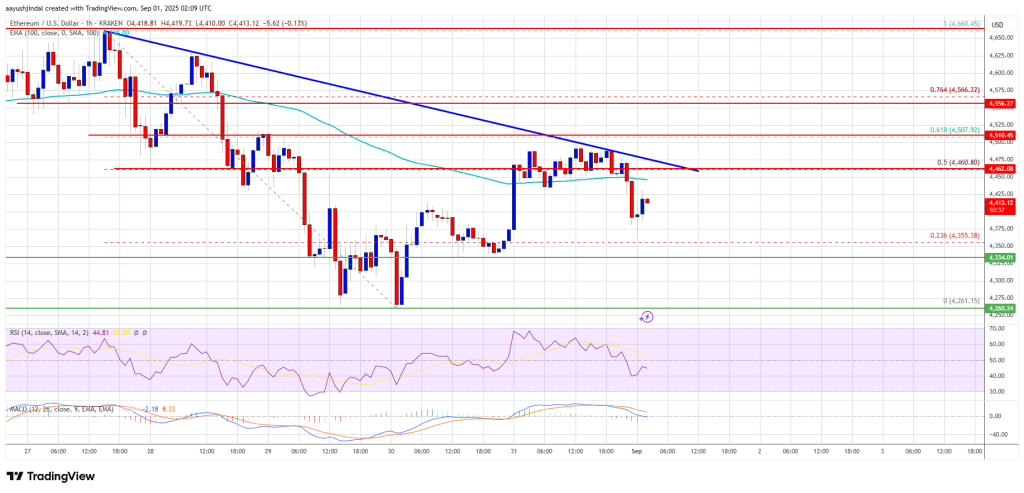
Ethereum Recent Gains in Danger – Could We See Another Drop?
Ethereum price started a fresh decline below the $4,650 zone. ETH is now showing bearish signs and m...