Cardano (ADA) Faces Selling Pressure – Is This the Start of a Trend?


Cardano price started a fresh decline below the $0.850 zone. ADA is now consolidating and might extend losses below the $0.80 support.
- ADA price started a fresh decline below the $0.850 support zone.
- The price is trading below $0.8320 and the 100-hourly simple moving average.
- There is a key bearish trend line forming with resistance at $0.820 on the hourly chart of the ADA/USD pair (data source from Kraken).
- The pair could start a fresh increase if it clears the $0.820 resistance zone.
Cardano Price Dips Further
After a steady increase, Cardano faced sellers near $0.880 and started a downside correction, like Bitcoin and Ethereum . ADA dipped below the $0.850 and $0.8320 support levels.
The bears even pushed the price below $0.820. A low was formed at $0.8003 and the price is now consolidating losses. There was a minor increase toward the 23.6% Fib retracement level of the recent decline from the $0.8376 swing high to the $0.8003 low.
Cardano price is now trading below $0.820 and the 100-hourly simple moving average. There is also a key bearish trend line forming with resistance at $0.820 on the hourly chart of the ADA/USD pair.
On the upside, the price might face resistance near the $0.820 zone. The first resistance is near $0.8280 or the 76.4% Fib retracement level of the recent decline from the $0.8376 swing high to the $0.8003 low. The next key resistance might be $0.840.
If there is a close above the $0.840 resistance, the price could start a strong rally. In the stated case, the price could rise toward the $0.8620 region. Any more gains might call for a move toward $0.880 in the near term.
Another Decline In ADA?
If Cardano’s price fails to climb above the $0.840 resistance level, it could start another decline. Immediate support on the downside is near the $0.80 level.
The next major support is near the $0.780 level. A downside break below the $0.780 level could open the doors for a test of $0.7620. The next major support is near the $0.750 level where the bulls might emerge.
Technical Indicators
Hourly MACD – The MACD for ADA/USD is gaining momentum in the bearish zone.
Hourly RSI (Relative Strength Index) – The RSI for ADA/USD is now below the 50 level.
Major Support Levels – $0.8000 and $0.7800.
Major Resistance Levels – $0.8200 and $0.8400.
Ethereum Will ‘Likely 100x From Here,’ Says Joe Lubin
Ethereum co-founder and ConsenSys CEO Joseph Lubin ignited ETH discourse on August 30 with an unusua...

Pundit Calls Bitcoin Price Crash Below $93,000, Reveals Bear Targets From Here
After hitting a new all-time high last month, the Bitcoin price has since retraced by more than 10%,...
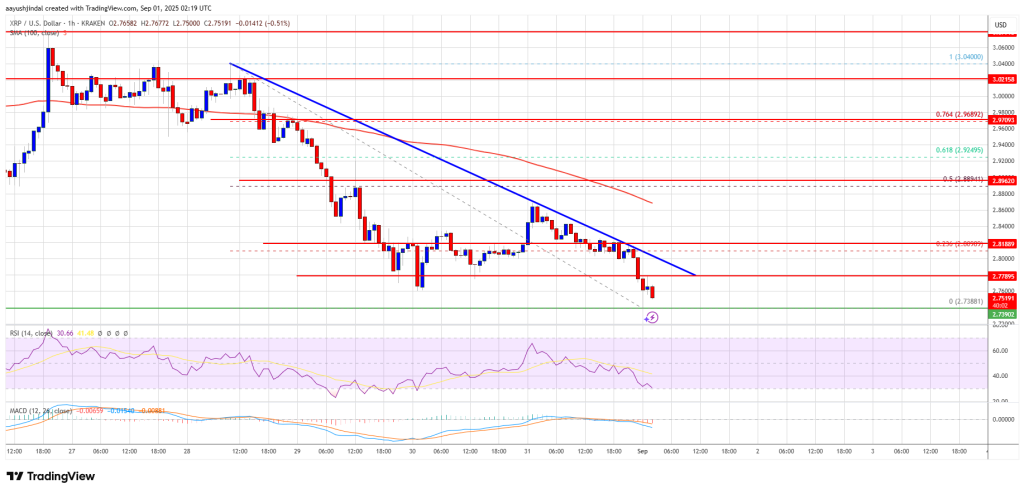
XRP Price Declines Further – Is a Bigger Crash on the Horizon?
XRP price is struggling to recover above the $3.00 resistance zone. The price is now declining and m...