The post BNB Eyes $1,000 Due to Surging Derivatives Activity: Will BNB Price Make a Comeback? appeared first on Coinpedia Fintech News
BNB price has been witnessing an extended consolidation due to overall price stagnation in the market. As Bitcoin struggles to break above $100K, several leading altcoins, including Binance Coin, are facing resistance around key psychological levels. However, BNB’s improving derivatives data and accumulation around recent dips might trigger a breakout. Traders are now becoming increasingly long on BNB as it prepares to break above $1,000.
BNB Sees Improved Market Activity
BNB price is seeing minor buying activity over the last 24 hours. Coinglass data shows that the total liquidation amount of BNB reached $357K and sellers liquidated around $236K worth of positions. However, Binance coin is witnessing an uptick in its open interest following several significant announcements.
The price increase comes after the Fermi hard fork went live on the BNB Smart Chain. This upgrade reduced block times from 0.75 seconds to 0.45 seconds, allowing the network to process transactions faster and confirm them more efficiently.
Also read: What to Expect From Bitcoin, Ethereum & XRP Prices Ahead of ‘CPI-Day’
As a result, the network is now better equipped to handle more advanced decentralized applications while reducing congestion during busy periods.
Additionally, interest from institutional players continues to surge in early January. Grayscale has recently filed for a BNB exchange-traded fund (ETF), which could open the door for investors who prefer traditional investment products over direct cryptocurrency usage, if the ETF is approved.
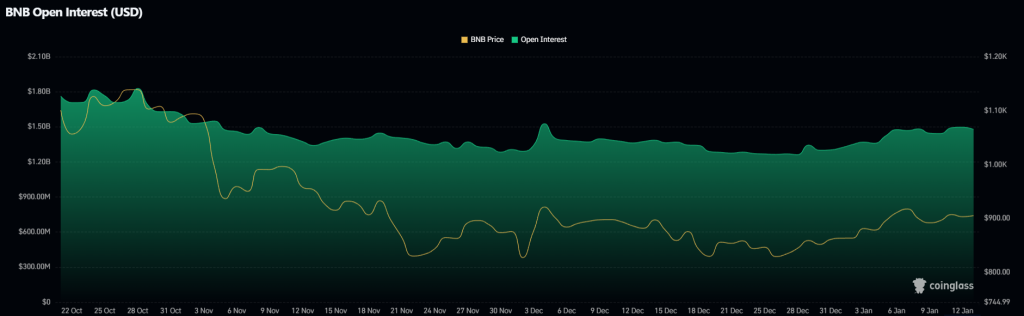
As a result of these, the OI of BNB has surged in recent weeks. Data from CoinGlass shows that open interest in BNB futures across exchanges climbed to $1.50 billion, up from $1.26 billion on December 27. This marks the highest level seen since early December.
Rising open interest suggests fresh capital is flowing into the market and that traders are placing more bets on price movement, which could help push BNB toward a breakout.
Additionally, BNB’s long-to-short ratio has surged to 1.6, the highest level in over a month. This ratio, above one, shows more traders are now expecting a bullish trend in the BNB price.
What’s Next for BNB Price?
BNB has been moving within a tight range, caught between its moving averages and the overhead resistance near $925. As of writing, BNB price trades at $912, surging over 1.5% in the last 24 hours.
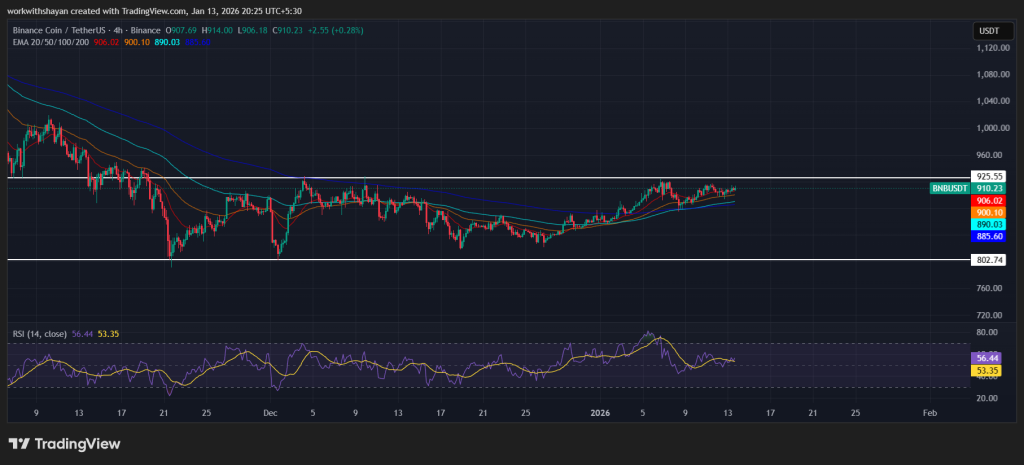
The rising 20-day EMA at around $906, along with the RSI staying in positive territory at level 58, suggests a higher chance of a move to the upside. A breakout above resistance at $925 would confirm a bullish ascending triangle pattern and could send the BNB/USDT pair above the key $1,000 level.
However, if the price reverses and falls below the moving averages, it would indicate strong selling pressure near $925. In that case, BNB could slide back to the support line and potentially test the $800 support level.