Cardano Struggles to Climb—ADA Faces Strong Hurdles Ahead


Cardano price started a fresh decline below the $0.75 zone. ADA is correcting some losses and might face resistance near the $0.750 level.
- ADA price started a recovery wave from the $0.650 zone.
- The price is trading below $0.750 and the 100-hourly simple moving average.
- There is a short-term bearish trend line forming with resistance at $0.720 on the hourly chart of the ADA/USD pair (data source from Kraken).
- The pair could start another increase if it clears the $0.750 resistance zone.
Cardano Price Climbs Higher
In the past few days, Cardano saw a bearish wave below the $0.80 level, like Bitcoin and Ethereum . ADA declined below the $0.750 and $0.70 support levels.
Finally, it tested the $0.650 zone. A low was formed at $0.6495 and the price recently started a recovery wave. The price climbed above the $0.680 and $0.70 level. The price tested the 50% Fib retracement level of the downward move from the $0.8169 swing high to the $0.6495 low.
There was a short-term bearish trend line forming with resistance at $0.720 on the hourly chart of the ADA/USD pair. Cardano price is now trading below $0.80 and the 100-hourly simple moving average.
On the upside, the price might face resistance near the $0.750 zone and the 61.8% Fib retracement level of the downward move from the $0.8169 swing high to the $0.6495 low. The first resistance is near $0.7750. The next key resistance might be $0.80.
If there is a close above the $0.80 resistance, the price could start a strong rally. In the stated case, the price could rise toward the $0.950 region. Any more gains might call for a move toward $1.00 in the near term.
Another Decline in ADA?
If Cardano’s price fails to climb above the $0.750 resistance level, it could start another decline. Immediate support on the downside is near the $0.7150 level.
The next major support is near the $0.6880 level. A downside break below the $0.6880 level could open the doors for a test of $0.650. The next major support is near the $0.6320 level where the bulls might emerge.
Technical Indicators
Hourly MACD – The MACD for ADA/USD is losing momentum in the bullish zone.
Hourly RSI (Relative Strength Index) – The RSI for ADA/USD is now below the 50 level.
Major Support Levels – $0.7150 and $0.6880.
Major Resistance Levels – $0.7500 and $0.7750.
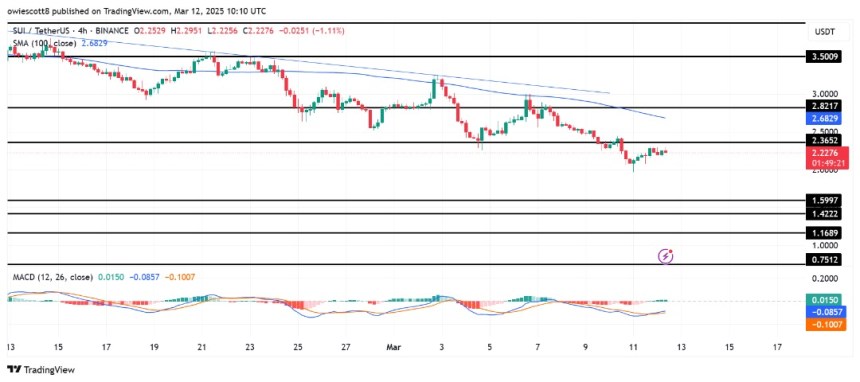
SUI Bulls Test Key Resistance — A Breakout Or Rejection Ahead?
SUI recent price recovery has reignited bullish sentiment, but its momentum is now being put to the ...
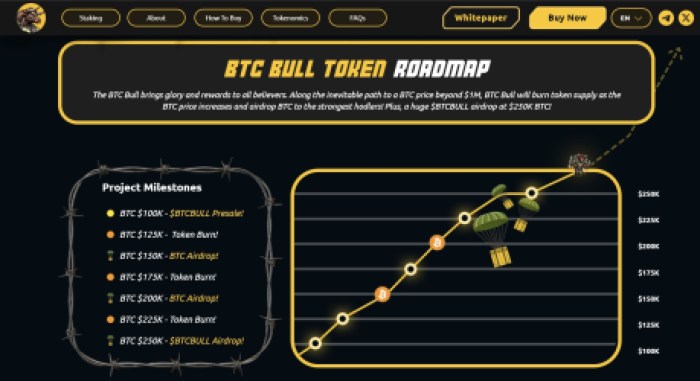
Solo Bitcoin Miner Earns 3.15 Bitcoins — You Can Earn Free $BTC Too With BTC Bull Token Airdrops
A solo miner hit what many are calling a jackpot, as he mined a Bitcoin block #887,212 with just a 4...

XRP Crashing? Analyst Sounds Alarm On Looming Price Threat
An analyst is expressing apprehension regarding the price movement of XRP, cautioning that the crypt...