Ethereum Price Charts Hint at Pullback — Support Levels In Focus


Ethereum price started a fresh surge above the $1,720 resistance. ETH is now correcting gains and might revisit the $1,700 support zone.
- Ethereum started a fresh rally above the $1,720 zone.
- The price is trading above $1,700 and the 100-hourly Simple Moving Average.
- There is a connecting bearish trend line forming with resistance at $1,780 on the hourly chart of ETH/USD (data feed via Kraken).
- The pair could start a fresh increase if it clears the $1,800 resistance zone.
Ethereum Price Signals Downside Correction
Ethereum price remained stable above the $1,680 level and started a fresh increase, like Bitcoin . ETH traded above the $1,720 and $1,750 levels. The bulls even pumped the price above the $1,800 level.
A high was formed at $1,834 and the price recently started a downside correction. There was a move below the 23.6% Fib retracement level of the upward move from the $1,565 swing low to the $1,834 high. The price even dipped below the $1,780 level.
There is also a connecting bearish trend line forming with resistance at $1,780 on the hourly chart of ETH/USD. Ethereum price is now trading above $1,720 and the 100-hourly Simple Moving Average.
On the upside, the price seems to be facing hurdles near the $1,780 level and the trend line. The next key resistance is near the $1,800 level. The first major resistance is near the $1,840 level. A clear move above the $1,840 resistance might send the price toward the $1,920 resistance .
An upside break above the $1,920 resistance might call for more gains in the coming sessions. In the stated case, Ether could rise toward the $1,950 resistance zone or even $2,000 in the near term.
Are Dips Limited In ETH?
If Ethereum fails to clear the $1,780 resistance, it could start a fresh decline. Initial support on the downside is near the $1,725 level. The first major support sits near the $1,700 zone and the 50% Fib retracement level of the upward move from the $1,565 swing low to the $1,834 high.
A clear move below the $1,700 support might push the price toward the $1,650 support. Any more losses might send the price toward the $1,620 support level in the near term. The next key support sits at $1,550.
Technical Indicators
Hourly MACD – The MACD for ETH/USD is losing momentum in the bullish zone.
Hourly RSI – The RSI for ETH/USD is now below the 50 zone.
Major Support Level – $1,700
Major Resistance Level – $1,800

Six of the Best Crypto Market Makers Supplying Liquidity in 2025
Crypto market makers: always essential, occasionally controversial, frequently misunderstood. It’s a...
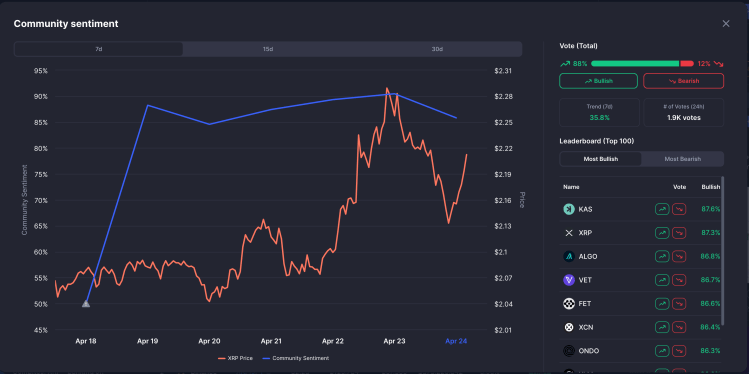
Is The XRP Price Rally Over At $2.22? New Developments Suggest Major Pump Is Coming
The XRP price rallied again to $2.22 after a relief rally rocked Bitcoin and the crypto market. This...

New Crypto to Follow Bitcoin as 21Capital Establishes $3.9B $BTC Treasury, Swiss Central Bank Weighs $BTC National Reserve
After the news of Cantor Fitzgerald’s partnership with SoftBank and Tether, the shares of Cantor Equ...