Why Has Bitcoin Rally Stalled? On-Chain Data Provides Hints


On-chain data shows a few Bitcoin indicators are following a trajectory that could potentially explain the reason why the latest rally has taken a pause.
Bitcoin On-Chain Metrics Have Seen Bearish Developments Recently
In a new post on X, an analyst has talked about how a few on-chain indicators related to Bitcoin have changed recently. The first metric of relevance is the “ Exchange Reserve ,” which measures the total amount of BTC that’s sitting in the wallets associated with centralized exchanges.
Below is the chart shared by the quant showing the trend in this indicator:

As is visible in the graph, the Bitcoin Exchange Reserve plunged alongside the recent price rally, suggesting the investors withdrew a large number of tokens from exchanges.
Generally, large withdrawals can be a sign that the holders are accumulating, so it could have been this buying activity that helped provide the fuel for the price rally.
From the chart, it’s apparent that in the last few days, the decline has ended and the indicator has taken to sideways movement. It may be no coincidence that the asset’s surge, too, has taken a pause alongside this trend.
For now, outflows are still balancing out inflows, but the indicator can be kept an eye on, as a reversal to net deposits could prove to be bearish for the cryptocurrency.
Another obstacle to the rally could be the fact that the investors have been participating in profit-taking recently. The metric that shows this trend is the Net Realized Profit and Loss (NRPL), which keeps track of the net amount of profit or loss that Bitcoin investors as a whole are realizing through their transactions.

Just earlier, the NRPL observed a large negative spike corresponding to a realized loss of $2 billion, but with the rally, its value has seen a sharp reversal into the positive territory. At the peak of this profit-taking spree, the metric managed to achieve a value of around $3 billion.
Another metric, the Spent Output Profit Ratio (SOPR) , also confirms the dominance of profit-taking.

The SOPR, much like NRPL, deals with profit/loss realization. The difference lies in that the NRPL shows the net situation, while the SOPR calculates the ratio between profit and loss.
As for which investors have been participating in the profit-taking, it would appear whale -sized entities (investors with more than 1,000 BTC) have been making some large moves. These humongous investors tend to carry some influence in the market, so their transfers are generally to look out for.

BTC Price
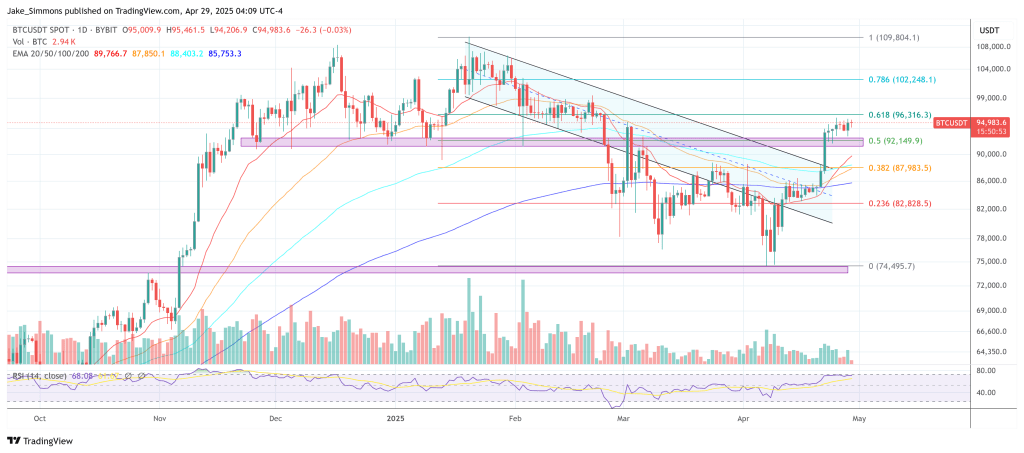
At the time of writing, Bitcoin is floating around $95,000, up around 10% in the last week.


Bitcoin To Explode To $210,000 This Year, Says Quant Powerhouse Presto
In a live interview on CNBC’s Squawk Box on Monday, Peter Chung, Head of Research at quantitative tr...

Technical Indicators Suggest Bitcoin May Reach $120,000 In Q2, Says Standard Chartered
A recent forecast by financial services company Standard Chartered, indicates that the market’s lead...

Record-Breaking Week: Bitcoin Climbs Over $95,000 Amidst $3 Billion ETF Inflows
Bitcoin (BTC), the leading cryptocurrency, is witnessing a notable resurgence, with its price nearin...

